Last active
July 23, 2019 19:46
-
-
Save cavedave/09294b98a4582d6c56d26d3fce0d72df to your computer and use it in GitHub Desktop.
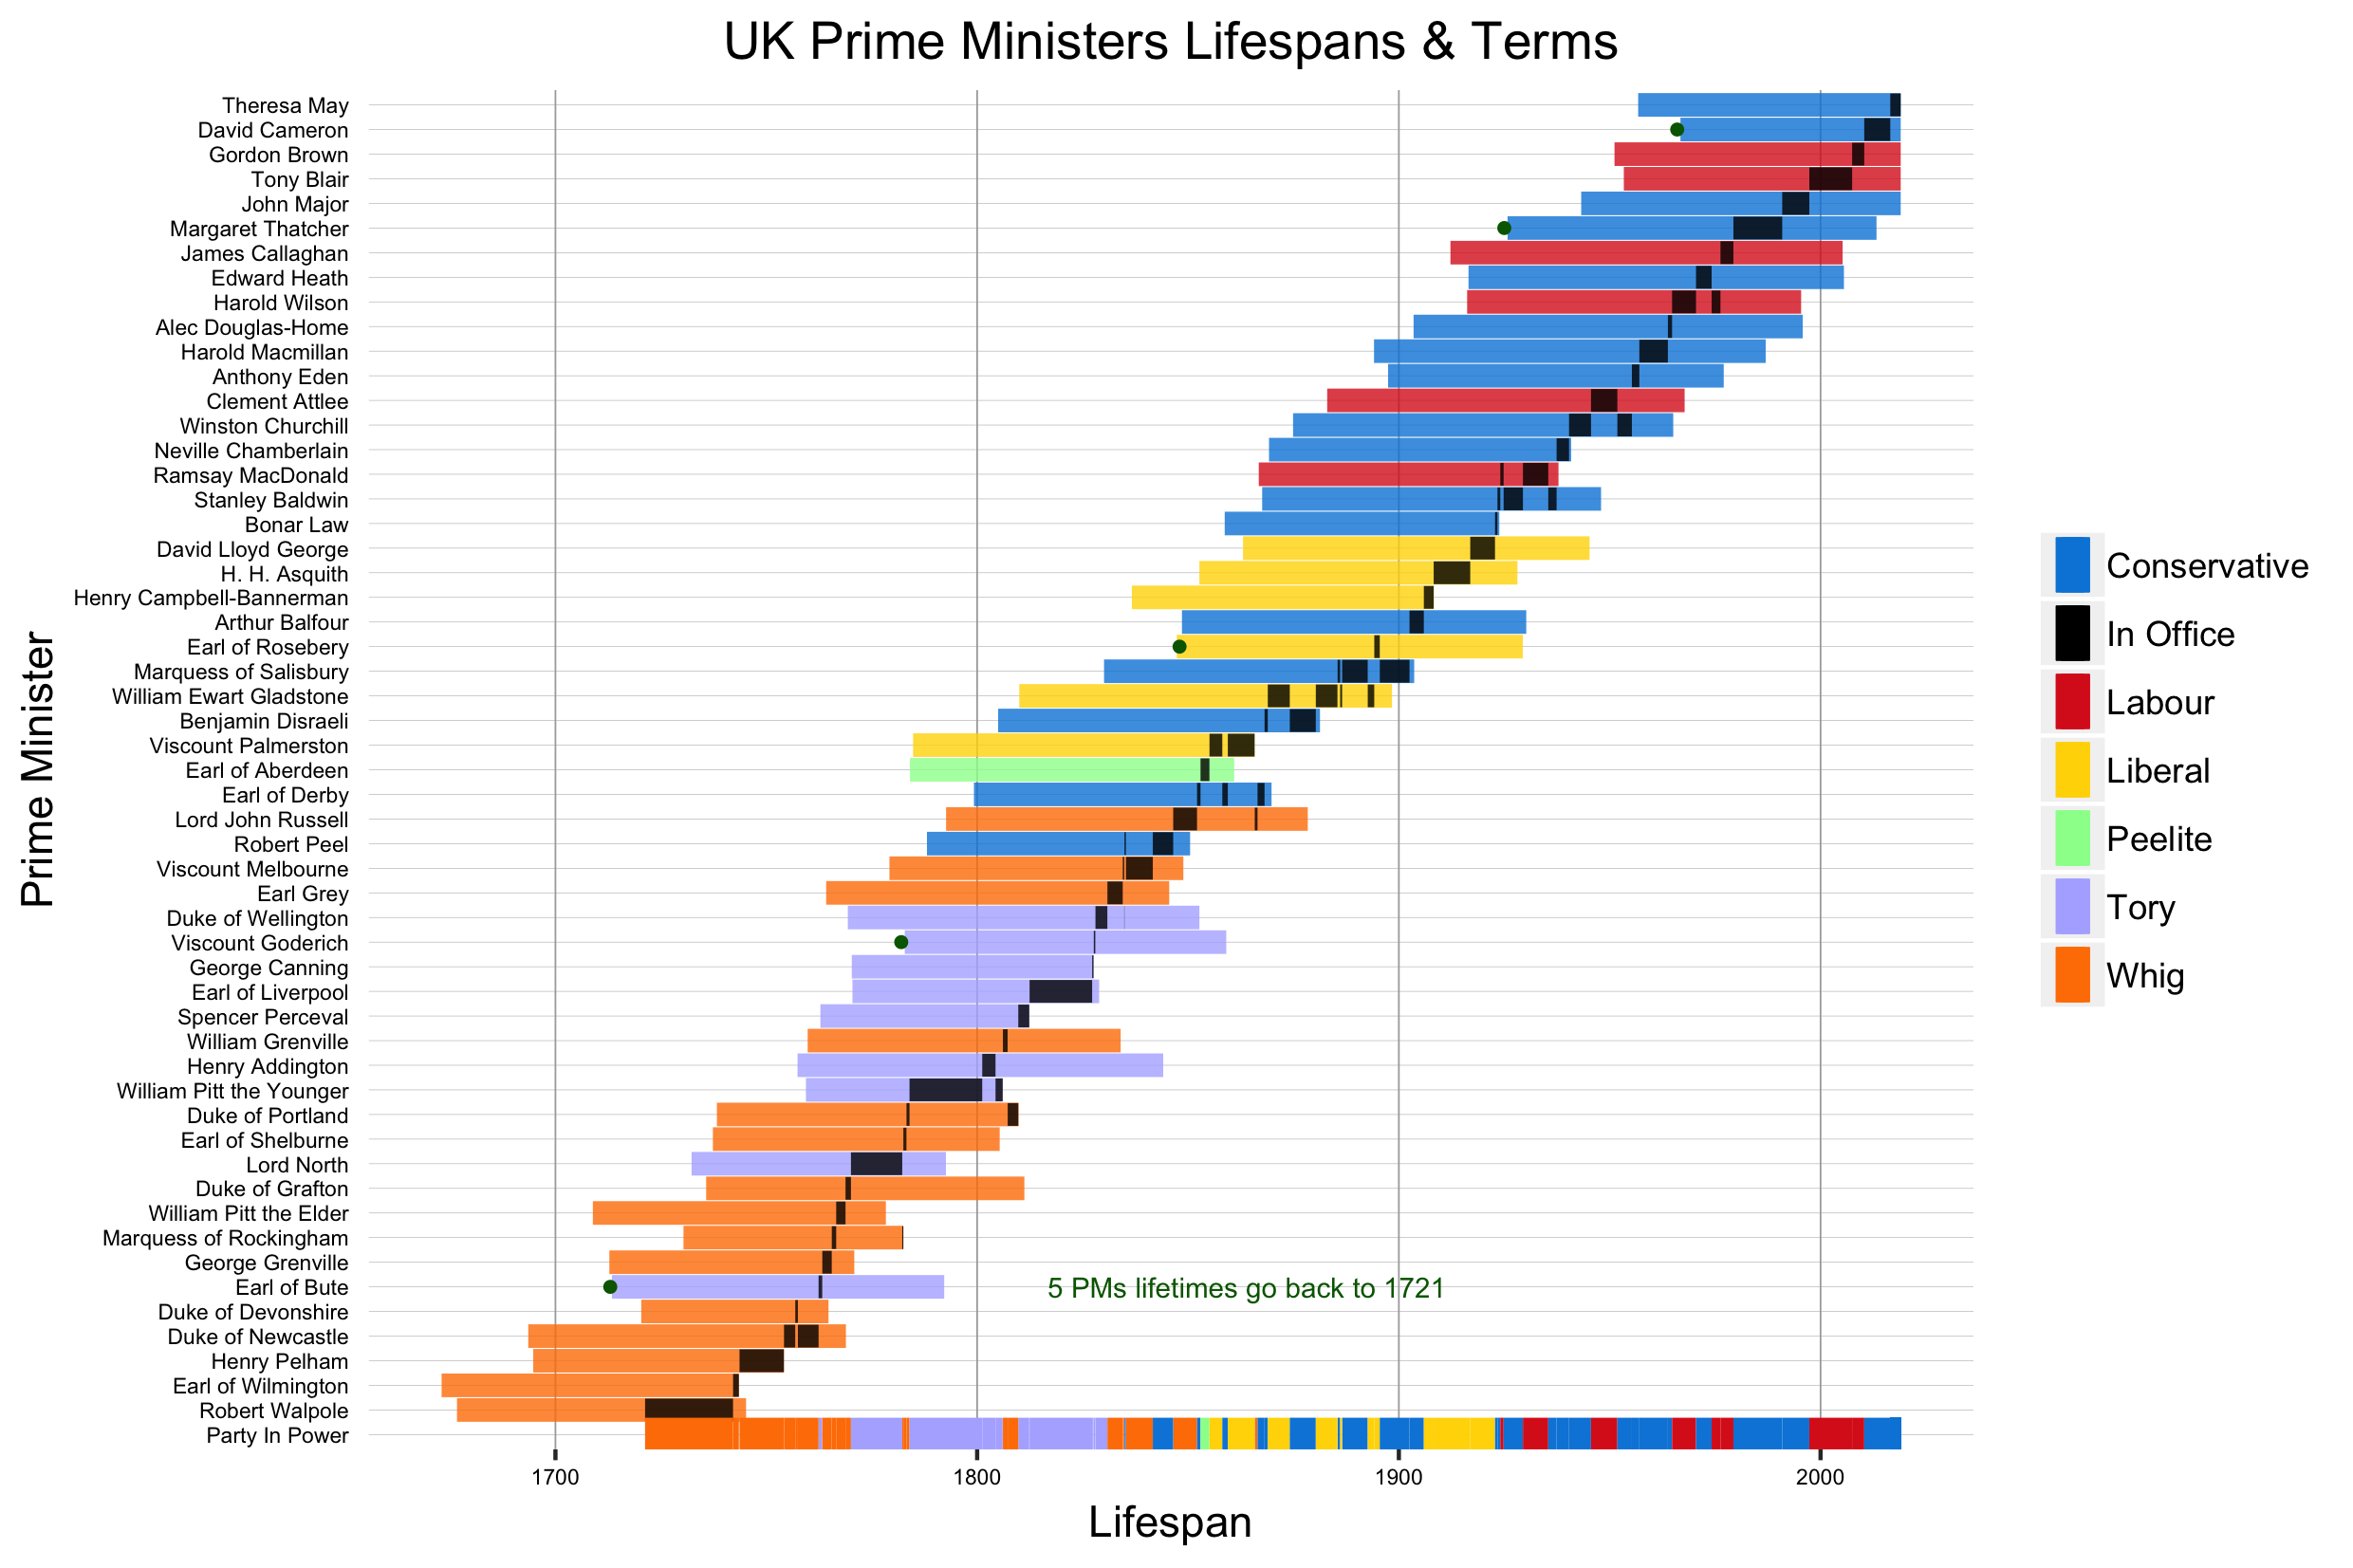
Graph of the lifespans of the prime ministers of the uk since 1721This is inspired by this graph [US Presidential Lifespans & Terms](https://www.reddit.com/r/dataisbeautiful/comments/8lrzgc/us_presidential_lifespans_terms_oc) Data from wikipedia [List of Prime Ministers of the United Kingdom](https://en.wikipedia.org/wiki/List_of_Prime_Ministers…
This file contains bidirectional Unicode text that may be interpreted or compiled differently than what appears below. To review, open the file in an editor that reveals hidden Unicode characters.
Learn more about bidirectional Unicode characters
| cols <- c("Conservative" = "#0087DC", "Labour" = "#DC241f", "Liberal" = "#ffd700", "Whig" = "#FF7F00","Peelite"="#99FF99","Tory"="#b2b2ff","In Office"="black") | |
| mydate <- as.Date("1900-01-01", "%Y-%m-%d") | |
| explain <- as.Date("1864-01-01", "%Y-%m-%d") | |
| Walpole <- as.Date("1676-04-01", "%Y-%m-%d") | |
| bute <- as.Date("1713-01-01", "%Y-%m-%d") | |
| Grenville <- as.Date("1712-10-14", "%Y-%m-%d") | |
| Elder <-as.Date("1708-11-15", "%Y-%m-%d") | |
| North <-as.Date("1732-04-13", "%Y-%m-%d") | |
| Grenville2 <-as.Date("1759-10-25", "%Y-%m-%d") | |
| Grey<-as.Date("1764-03-13", "%Y-%m-%d") | |
| Lamb<-as.Date("1779-03-15", "%Y-%m-%d") | |
| Derby<-as.Date("1799-03-29", "%Y-%m-%d") | |
| Gladstone<-as.Date("1809-12-29", "%Y-%m-%d") | |
| Salisbury<-as.Date("1830-02-03", "%Y-%m-%d") | |
| Rosebery<-as.Date("1847-05-07", "%Y-%m-%d") | |
| Eden<-as.Date("1897-06-12", "%Y-%m-%d") | |
| Macmillan<-as.Date("1894-02-10", "%Y-%m-%d") | |
| Home<-as.Date("1903-07-02", "%Y-%m-%d") | |
| Canning<- as.Date("1770-04-11", "%Y-%m-%d") | |
| Wellington<- as.Date("1769-05-01", "%Y-%m-%d") | |
| balfour<- as.Date("1848-01-01", "%Y-%m-%d") | |
| cameron<- as.Date("1966-01-01", "%Y-%m-%d") | |
| johnson <- as.Date("1964-06-19", "%Y-%m-%d") | |
| May <- as.Date("2016-07-13", "%Y-%m-%d") | |
| MayEnd <- as.Date("2019-07221", "%Y-%m-%d") | |
| #gant_data_raw<- gant_data_raw[seq(dim(gant_data_raw)[1],1),] | |
| p<-ggplot()+ | |
| ggtitle("UK Prime Ministers Lifespans,Terms")+ | |
| ylab("Lifespan")+ | |
| xlab("Prime Minister") + | |
| geom_linerange(data=gant_data_raw,aes(x=name,ymin=birth,ymax=death,color=Party),size=2.8,alpha=0.8)+ | |
| geom_linerange(data=gant_data_raw,aes(x=name,ymin=start,ymax=end,color="In Office"),size=2.7,alpha=0.8)+ | |
| geom_linerange(data=gant_data_raw,aes(x=name,ymin=start2,ymax=end2,color="In Office"),size=2.7,alpha=0.8)+ | |
| geom_linerange(data=gant_data_raw,aes(x=name,ymin=start3,ymax=end3,color="In Office"),size=2.7,alpha=0.8)+ | |
| geom_linerange(data=gant_data_raw,aes(x=name,ymin=start4,ymax=end4,color="In Office"),size=2.7,alpha=0.8)+ | |
| #want to mark the prime ministers needed to make a path through hstory | |
| #geom_point(aes(x=mydate, y=3.9), colour="blue")+ | |
| # geom_point(mapping=aes(x=mydate, y="Earl of Bute", shape="circle", color="red", size=5))+ | |
| # geom_point(data=data,size=4, shape=19,color = "blue"),aes(x = xaxis, y = yaxis) )+ | |
| coord_flip()+ | |
| #now one line of who is in office at any one time | |
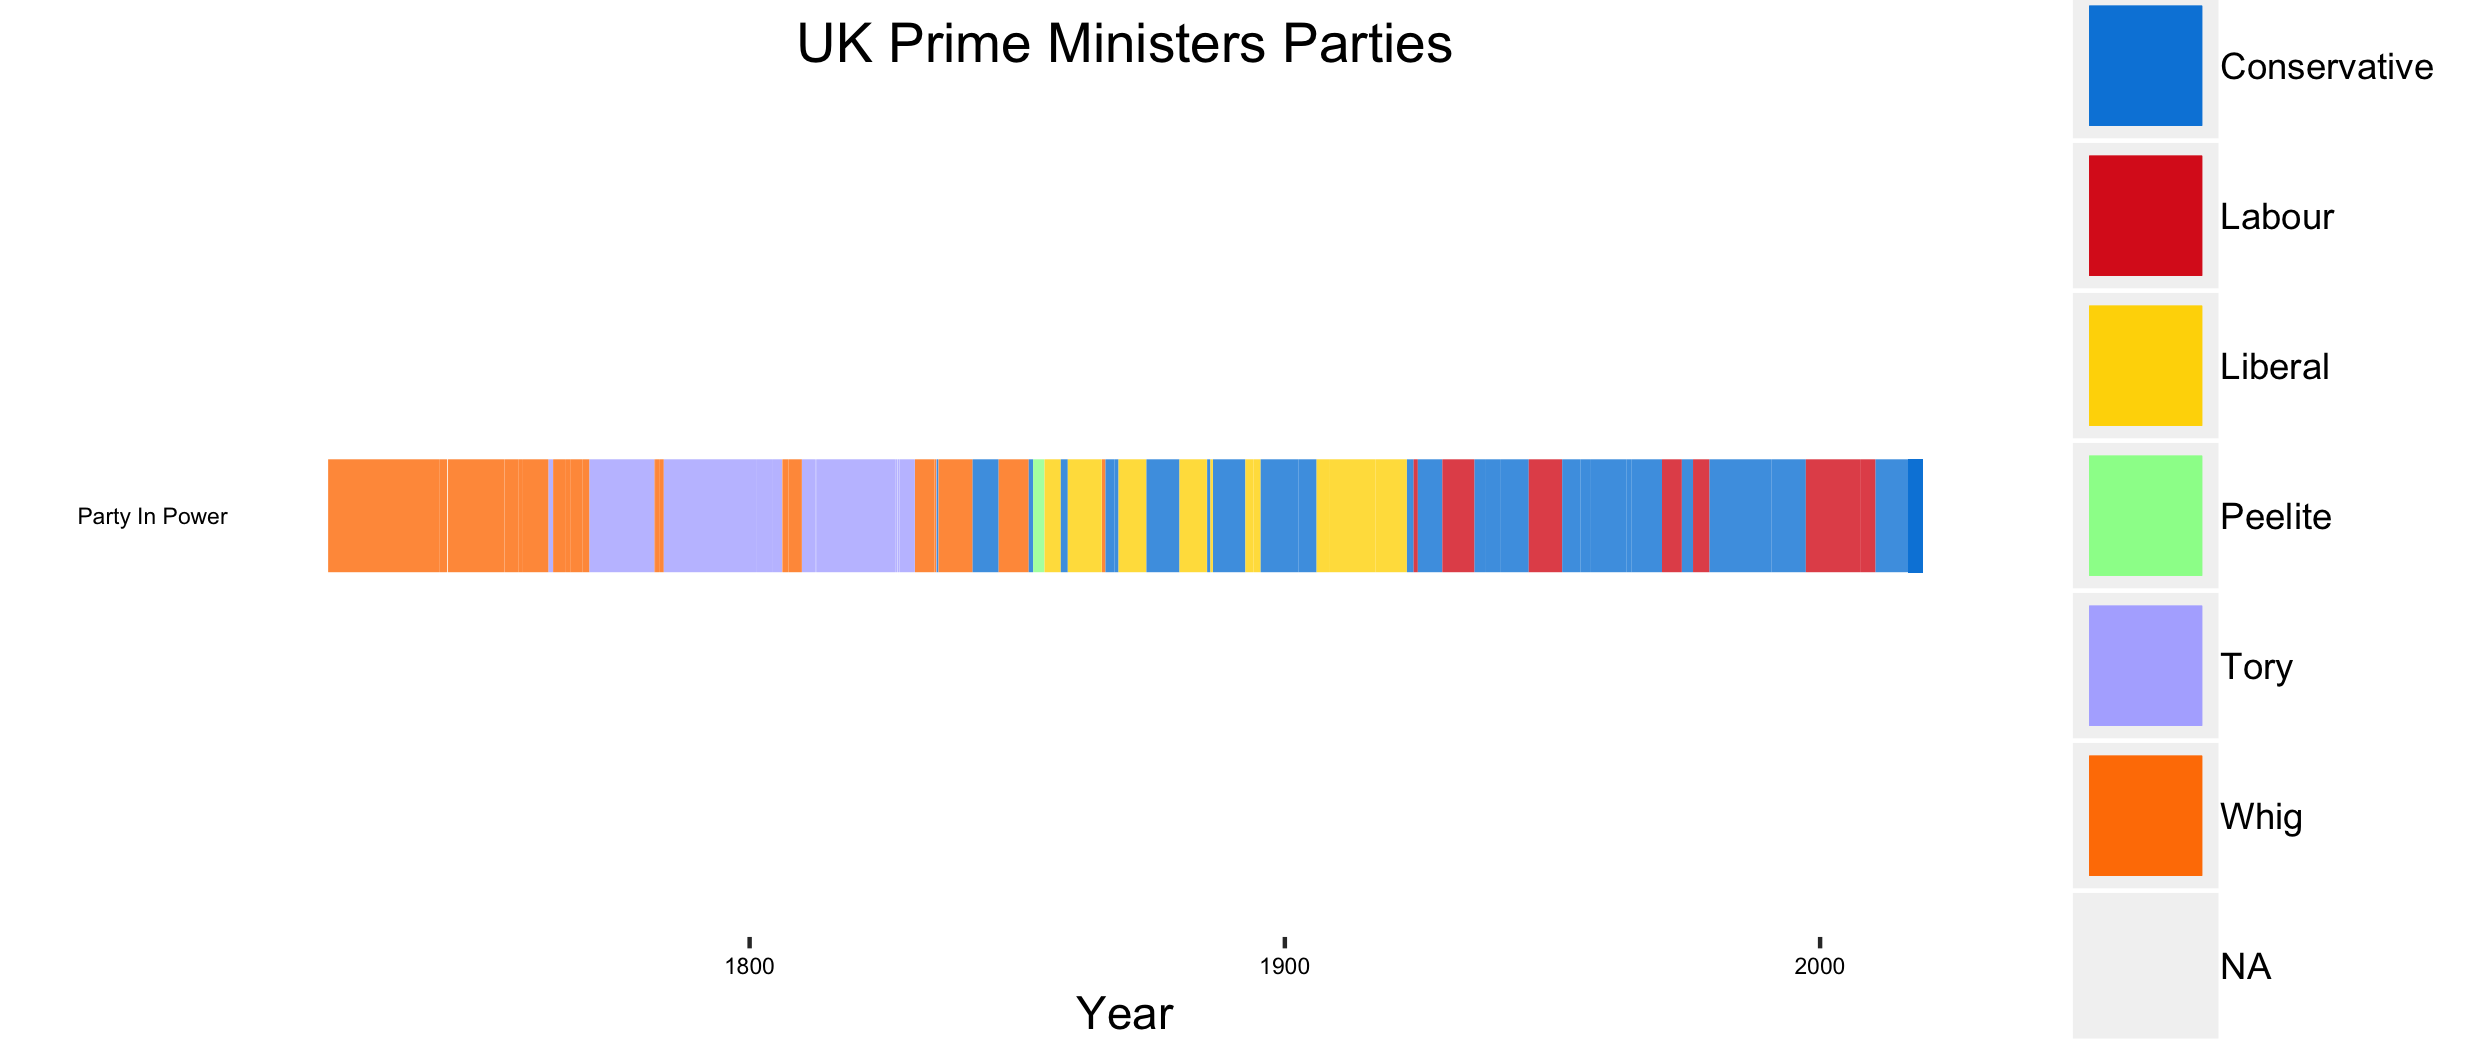
| geom_linerange(data=gant_data_raw,aes(x="Party In Power",ymin=start,ymax=end,color=Party),size=4)+ | |
| geom_linerange(data=gant_data_raw,aes(x="Party In Power",ymin=start2,ymax=end2,color=Party),size=4)+ | |
| geom_linerange(data=gant_data_raw,aes(x="Party In Power",ymin=start3,ymax=end3,color=Party),size=4)+ | |
| geom_linerange(data=gant_data_raw,aes(x="Party In Power",ymin=start4,ymax=end4,color=Party),size=4)+#,alpha=0.8 | |
| #now need mays time 13 July 2016 | |
| geom_linerange(data=gant_data_raw,aes(x="Party In Power",ymin=May,ymax=MayEnd,color="Conservative"),size=4,alpha=0.8)+ | |
| scale_colour_manual(values = cols)+ | |
| #Dots for continious prime ministers | |
| #geom_point(data=PresentLows, aes(x=20, y=mydate), colour="blue3") + | |
| annotate("point", x = 2, y =Walpole, size=1, colour="darkgreen") + | |
| annotate("point", x = 7, y =bute, size=1, colour="darkgreen") + | |
| annotate("point", x = 8, y =Grenville, size=1, colour="darkgreen") + | |
| annotate("point", x = 10, y =Elder, size=1, colour="darkgreen") + | |
| annotate("point", x = 12, y =North, size=1, colour="darkgreen") + | |
| annotate("point", x = 17, y =Grenville2, size=1, colour="darkgreen") + | |
| annotate("point", x = 20, y =Canning, size=1, colour="darkgreen") + | |
| annotate("point", x = 22, y =Wellington, size=1, colour="darkgreen") + | |
| annotate("point", x = 23, y =Grey, size=1, colour="darkgreen") + | |
| annotate("point", x = 24, y =Lamb, size=1, colour="darkgreen") + | |
| annotate("point", x = 27, y =Derby, size=1, colour="darkgreen") + | |
| annotate("point", x = 31, y =Gladstone, size=1, colour="darkgreen") + | |
| annotate("point", x = 32, y =Salisbury, size=1, colour="darkgreen") + | |
| annotate("point", x = 33, y =Rosebery, size=1, colour="darkgreen") + | |
| annotate("point", x = 34, y =balfour, size=1, colour="darkgreen") + | |
| annotate("point", x = 44, y =Eden, size=1, colour="darkgreen") + | |
| annotate("point", x = 45, y =Macmillan, size=1, colour="darkgreen") + | |
| annotate("point", x = 46, y =Home, size=1, colour="darkgreen") + | |
| annotate("point", x = 54, y =cameron, size=1, colour="darkgreen") + | |
| annotate("point", x = 56, y =johnson, size=1, colour="darkgreen") + | |
| annotate("text", x = 7, y = explain, label = "20 PMs went to Eton", size=4, colour="darkgreen")+ | |
| # annotate("segment", x = 30, xend = 40, y = -5, yend = -10, colour = "blue3") + | |
| #text annotation | |
| # annotate("text", x = 10, y = mydate, label = "Time in Office", size=3, colour="black")+ | |
| # theme_light() | |
| theme(panel.background=element_rect(fill="white"), axis.ticks.y=element_blank(),legend.title = element_blank(),axis.text=element_text(colour ="black",size=7.5),panel.grid.major.x = element_line(colour ="darkgrey",size = 0.2),panel.grid.major.y = element_line(colour ="grey",size = 0.071))#legend.position="none", ,panel.grid.minor=element_blank() | |
| p | |
| ggsave("Jul16a.png",p,width=210,height=140,unit="mm",dpi=300) | |
| #ggplot(df_melted, aes(value, name,colour=Party)) |
We can make this file beautiful and searchable if this error is corrected: It looks like row 49 should actually have 13 columns, instead of 14. in line 48.
This file contains bidirectional Unicode text that may be interpreted or compiled differently than what appears below. To review, open the file in an editor that reveals hidden Unicode characters.
Learn more about bidirectional Unicode characters
| ,name,birth,death,Party,start,end,start2,end2,start3,end3,start4,end4 | |
| 0,Party In Power,,,,,,,,,,, | |
| 1,Robert Walpole,1676-08-26,1745-03-18,Whig,1721-04-03,1742-02-11,,,,,, | |
| 2,Earl of Wilmington,1673-01-01,1743-07-02,Whig,1742-02-16,1743-07-02,,,,,, | |
| 3,Henry Pelham,1694-09-25,1754-03-06,Whig,1743-08-27,1754-03-06,,,,,, | |
| 4,Duke of Newcastle,1693-07-21,1768-11-17,Whig,1754-03-16,1756-11-11,1757-06-29,1762-05-26,,,, | |
| 5,Duke of Devonshire,1720-05-08,1764-10-02,Whig,1756-11-16,1757-06-29,,,,,, | |
| 6,Earl of Bute,1713-05-25,1792-03-10,Tory,1762-05-26,1763-04-08,,,,,, | |
| 7,George Grenville,1712-10-14,1770-11-13,Whig,1763-04-16,1765-07-10,,,,,, | |
| 8,Marquess of Rockingham,1730-05-13,1782-07-01,Whig,1765-07-13,1766-07-30,1782-03-27,1782-07-01,,,, | |
| 9,William Pitt the Elder,1708-11-15,1778-05-11,Whig,1766-07-30,1768-10-14,,,,,, | |
| 10,Duke of Grafton,1735-09-28,1811-03-14,Whig,1768-10-14,1770-01-28,,,,,, | |
| 11,Lord North,1732-04-13,1792-08-05,Tory,1770-01-28,1782-03-27,,,,,, | |
| 12,Earl of Shelburne,1737-05-02,1805-05-07,Whig,1782-07-04,1783-03-26,,,,,, | |
| 13,Duke of Portland,1738-04-14,1809-10-30,Whig,1783-04-02,1783-12-18,1807-03-31,1809-10-04,,,, | |
| 14,William Pitt the Younger,1759-05-28,1806-01-23,Tory,1783-12-19,1801-03-14,1804-05-10,1806-01-23,,,, | |
| 15,Henry Addington,1757-05-30,1844-02-15,Tory,1801-03-17,1804-05-10,,,,,, | |
| 16,William Grenville,1759-10-25,1834-01-12,Whig,1806-02-11,1807-03-25,,,,,, | |
| 17,Spencer Perceval,1762-11-01,1812-05-11,Tory,1809-10-04,1812-05-11,,,,,, | |
| 18,Earl of Liverpool,1770-06-07,1828-12-04,Tory,1812-06-08,1827-04-09,,,,,, | |
| 19,George Canning,1770-04-11,1827-08-08,Tory,1827-04-12,1827-08-08,,,,,, | |
| 20,Viscount Goderich,1782-11-01,1859-01-28,Tory,1827-08-31,1828-01-08,,,,,, | |
| 21,Duke of Wellington,1769-05-01,1852-09-14,Tory,1828-01-22,1830-11-16,1834-11-17,1834-12-09,,,, | |
| 22,Earl Grey,1764-03-13,1845-07-17,Whig,1830-11-22,1834-07-09,,,,,, | |
| 23,Viscount Melbourne,1779-03-15,1848-11-24,Whig,1834-07-16,1834-11-14,1835-04-18,1841-08-30,,,, | |
| 24,Robert Peel,1788-02-05,1850-07-02,Conservative,1834-12-10,1835-04-08,1841-08-30,1846-06-29,,,, | |
| 25,Lord John Russell,1792-08-18,1878-05-28,Whig,1846-06-30,1852-02-21,1865-10-29,1866-06-26,,,, | |
| 26,Earl of Derby,1799-03-29,1869-10-23,Conservative,1852-02-23,1852-12-17,1858-02-20,1859-06-11,1866-06-28,1868-02-25,, | |
| 27,Earl of Aberdeen,1784-01-28,1860-12-14,Peelite,1852-12-19,1855-01-30,,,,,, | |
| 28,Viscount Palmerston,1784-10-20,1865-10-18,Liberal,1855-02-06,1858-02-19,1859-06-12,1865-10-18,,,, | |
| 29,Benjamin Disraeli,1804-12-21,1881-04-19,Conservative,1868-02-27,1868-12-01,1874-02-20,1880-04-21,,,, | |
| 30,William Ewart Gladstone,1809-12-29,1898-05-19,Liberal,1868-12-03,1874-02-17,1880-04-23,1885-06-09,1886-02-01,1886-07-20,1892-08-15,1894-03-02 | |
| 31,Marquess of Salisbury,1830-02-03,1903-08-22,Conservative,1885-06-23,1886-01-28,1886-07-25,1892-08-11,1895-06-25,1902-07-11,, | |
| 32,Earl of Rosebery,1847-05-07,1929-05-21,Liberal,1894-03-05,1895-06-22,,,,,, | |
| 33,Arthur Balfour,1848-07-25,1930-03-19,Conservative,1902-07-12,1905-12-04,,,,,, | |
| 34,Henry Campbell-Bannerman,1836-09-07,1908-04-22,Liberal,1905-12-05,1908-04-05,,,,,, | |
| 35,H. H. Asquith,1852-09-12,1928-02-15,Liberal,1908-04-05,1916-12-05,,,,,, | |
| 36,David Lloyd George,1863-01-17,1945-03-26,Liberal,1916-12-06,1922-10-19,,,,,, | |
| 37,Bonar Law,1858-09-16,1923-10-30,Conservative,1922-10-23,1923-05-20,,,,,, | |
| 38,Stanley Baldwin,1867-08-03,1947-12-14,Conservative,1923-05-22,1924-01-22,1924-11-04,1929-06-04,1935-06-07,1937-05-28,, | |
| 39,Ramsay MacDonald,1866-10-12,1937-11-09,Labour,1924-01-22,1924-11-04,1929-06-05,1935-06-07,,,, | |
| 40,Neville Chamberlain,1869-03-18,1940-11-09,Conservative,1937-05-28,1940-05-10,,,,,, | |
| 41,Winston Churchill,1874-11-30,1965-01-24,Conservative,1940-05-10,1945-07-26,1951-10-26,1955-04-05,,,, | |
| 42,Clement Attlee,1883-01-03,1967-10-08,Labour,1945-07-26,1951-10-26,,,,,, | |
| 43,Anthony Eden,1897-06-12,1977-01-14,Conservative,1955-04-06,1957-01-09,,,,,, | |
| 44,Harold Macmillan,1894-02-10,1986-12-29,Conservative,1957-01-10,1963-10-18,,,,,, | |
| 45,Alec Douglas-Home,1903-07-02,1995-10-09,Conservative,1963-10-19,1964-10-16,,,,,, | |
| 46,Harold Wilson,1916-03-11,1995-05-24,Labour,1964-10-16,1970-06-19,1974-03-04,1976-04-05,,,, | |
| 47,Edward Heath,1916-07-09,2005-07-17,Conservative,1970-06-19,1974-03-04,,,,,,, | |
| 48,James Callaghan,1912-03-27,2005-03-26,Labour,1976-04-05,1979-05-04,,,,,, | |
| 49,Margaret Thatcher,1925-10-13,2013-04-08,Conservative,1979-05-04,1990-11-28,,,,,, | |
| 50,John Major,1943-03-29,2019-01-01,Conservative,1990-11-28,1997-05-02,,,,,, | |
| 51,Tony Blair,1953-05-06,2019-01-01,Labour,1997-05-02,2007-06-27,,,,,, | |
| 52,Gordon Brown,1951-02-20,2019-01-01,Labour,2007-06-27,2010-05-11,,,,,, | |
| 53,David Cameron,1966-10-09,2019-01-01,Conservative,2010-05-11,2016-07-13,,,,,, | |
| 54,Theresa May,1956-10-01,2019-01-01,Conservative,2016-07-13,2019-01-01,,,,,, | |
| 55,Boris Johnson,1964-06-19,2019-07-01,Conservative,2019-7-22,2019-07-22,,,,,, |
This file contains bidirectional Unicode text that may be interpreted or compiled differently than what appears below. To review, open the file in an editor that reveals hidden Unicode characters.
Learn more about bidirectional Unicode characters
| library(tidyverse) | |
| gant_data_raw <- read_csv("mp6.csv") | |
| head(gant_data_raw) | |
| #clean up csv that seems to include extra rows at end | |
| gant_data_raw=gant_data_raw[-57, ] | |
| #clean up dates | |
| library(lubridate) | |
| gant_data_raw$birth <- ymd(gant_data_raw$birth) | |
| gant_data_raw$death <-ymd(gant_data_raw$death) | |
| #need to make name a factor so that the graph does not list the prime ministers alphabetically | |
| gant_data_raw$name <- factor(gant_data_raw$name, levels = gant_data_raw$name) | |
| cols <- c("Conservative" = "#0087DC", "Labour" = "#DC241f", "Liberal" = "#ffd700", "Whig" = "#FF7F00","Peelite"="#99FF99","Tory"="#b2b2ff","In Office"="black") | |
| mydate <- as.Date("1900-01-01", "%Y-%m-%d") | |
| explain <- as.Date("1864-01-01", "%Y-%m-%d") | |
| bute <- as.Date("1713-01-01", "%Y-%m-%d") | |
| goderich<- as.Date("1782-01-01", "%Y-%m-%d") | |
| balfour<- as.Date("1848-01-01", "%Y-%m-%d") | |
| thatcher<- as.Date("1925-01-01", "%Y-%m-%d") | |
| cameron<- as.Date("1966-01-01", "%Y-%m-%d") | |
| May <- as.Date("2016-07-13", "%Y-%m-%d") | |
| MayEnd <- as.Date("2019-01-01", "%Y-%m-%d") | |
| #gant_data_raw<- gant_data_raw[seq(dim(gant_data_raw)[1],1),] | |
| p<-ggplot()+ | |
| ggtitle("UK Prime Ministers Lifespans & Terms")+ | |
| ylab("Lifespan")+ | |
| xlab("Prime Minister") + | |
| geom_linerange(data=gant_data_raw,aes(x=name,ymin=birth,ymax=death,color=Party),size=2.8,alpha=0.8)+ | |
| geom_linerange(data=gant_data_raw,aes(x=name,ymin=start,ymax=end,color="In Office"),size=2.7,alpha=0.8)+ | |
| geom_linerange(data=gant_data_raw,aes(x=name,ymin=start2,ymax=end2,color="In Office"),size=2.7,alpha=0.8)+ | |
| geom_linerange(data=gant_data_raw,aes(x=name,ymin=start3,ymax=end3,color="In Office"),size=2.7,alpha=0.8)+ | |
| geom_linerange(data=gant_data_raw,aes(x=name,ymin=start4,ymax=end4,color="In Office"),size=2.7,alpha=0.8)+ | |
| coord_flip()+ | |
| #now one line of who is in office at any one time | |
| geom_linerange(data=gant_data_raw,aes(x="Party In Power",ymin=start,ymax=end,color=Party),size=4,alpha=0.8)+ | |
| geom_linerange(data=gant_data_raw,aes(x="Party In Power",ymin=start2,ymax=end2,color=Party),size=4,alpha=0.8)+ | |
| geom_linerange(data=gant_data_raw,aes(x="Party In Power",ymin=start3,ymax=end3,color=Party),size=4,alpha=0.8)+ | |
| geom_linerange(data=gant_data_raw,aes(x="Party In Power",ymin=start4,ymax=end4,color=Party),size=4,alpha=0.8)+ | |
| #now need mays time 13 July 2016 | |
| geom_linerange(data=gant_data_raw,aes(x="Party In Power",ymin=May,ymax=MayEnd,color="Conservative"),size=4,alpha=0.8)+ | |
| scale_colour_manual(values = cols)+ | |
| #Dots for continious prime ministers | |
| #want to mark the prime ministers needed to make a path through hstory | |
| annotate("point", x = 7, y =bute, size=1, colour="darkgreen") + | |
| annotate("point", x = 21, y =goderich, size=1, colour="darkgreen") + | |
| annotate("point", x = 33, y =balfour, size=1, colour="darkgreen") + | |
| annotate("point", x = 50, y =thatcher, size=1, colour="darkgreen") + | |
| annotate("point", x = 54, y =cameron, size=1, colour="darkgreen") + | |
| annotate("text", x = 7, y = explain, label = "5 PMs lifetimes go back to 1721", size=2.5, colour="darkgreen")+ | |
| theme(panel.background=element_rect(fill="white"), axis.ticks.y=element_blank(),legend.title = element_blank(),axis.text=element_text(colour ="black",size=5.5),panel.grid.major.x = element_line(colour ="darkgrey",size = 0.2))#legend.position="none", ,panel.grid.minor=element_blank() | |
| p | |
| ggsave("pm5.png",p,width=210,height=140,unit="mm",dpi=300) |
Author
cavedave
commented
Feb 15, 2019


With Y axis lines

Fixed Harold Wilson, HEath mix up and added in May to combined graph
Sign up for free
to join this conversation on GitHub.
Already have an account?
Sign in to comment