| layout | category | published | title | subtitle | image | splash | splashclass | permalink | tags | |
|---|---|---|---|---|---|---|---|---|---|---|
blog |
blog |
false |
Maps with d3 |
Using the powerful visualization library with tiles from MapBox |
dark |
/blog/maps-with-d3 |
|
In the past year, the d3 framework has risen to the top of the heap of Javascript visualization tools. Its approach to fast, standards-centric and data-driven code has been extremely successful for good reason.
While much of d3's geospatial code is targeted towards vectors and incredible projections, it's also a great system for tile-based maps.
The iD editor project for OpenStreetMap uses d3 exclusively for all map features - tiles, overlays, markers, and vectors. We've built a map rendering stack in d3, as well as sophisticated labeling.

The most basic support for tiles in d3 comes from the d3-plugins project, which
has a plugin called d3.geo.tile which generates 256x256 tile coordinates
for use in a map. Here's an example of simply using d3.geo.tile to create
a map, heavily based off of Mike Bostock's
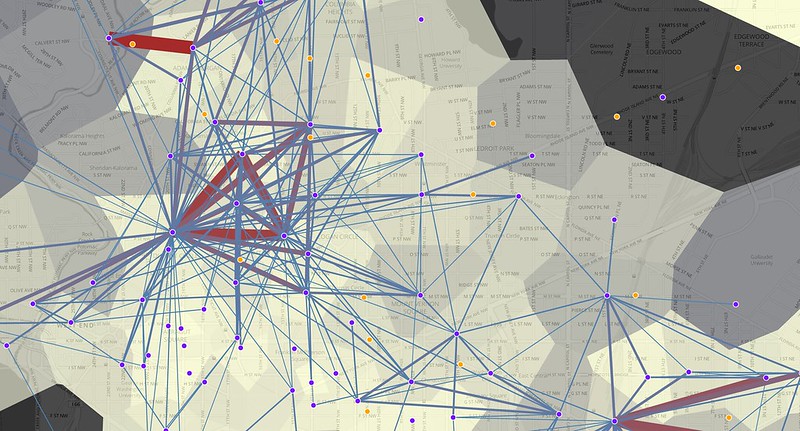
But you can do much more - here's an example of using multiple overlays on a map with d3, using d3's powerful built-in features like Voronoi Tesselations and intelligent scales. This is using Capital Bikeshare and DDOT data for existing and planned bike sharing stations, showing the result of adding more capacity to the system.
<iframe src='http://bl.ocks.org/tmcw/raw/4350773/' width='100%' height='300px'> </iframe>You can check out that map in fullscreen. As you can see, d3 gives you the power to use any SVG elements as a map overlay, which enables creative and detailed visualizations.
The building blocks of d3 are very low-level - at the very center of its geographical support are simple projection implementations that convert latitude and longitude into pixels on a screen and back. On top of that ability, it has basic constructs like the zooming and panning behavior from typical web maps.
There's quite a bit more to web maps than simply tiles - little touches like tiles only disappearing when their replacements are ready or transitions between centerpoints and zoom levels aren't built into these basic examples. As a result, Mike Migurski has been building Squares, an abstraction on top of d3 that makes its mapping features easier to use and more polished.