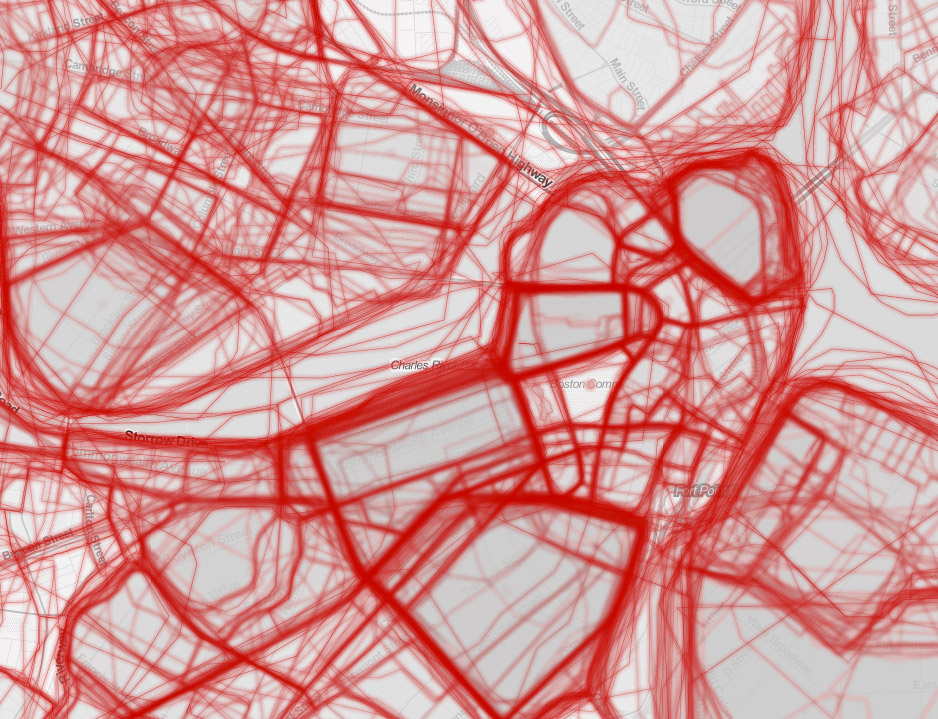
A ton of overlapping polygons, representing neighborhoods that people drew and named. (GeoJSON here.) Well-known neighborhoods will have many polygons with the same name, and similar shapes.
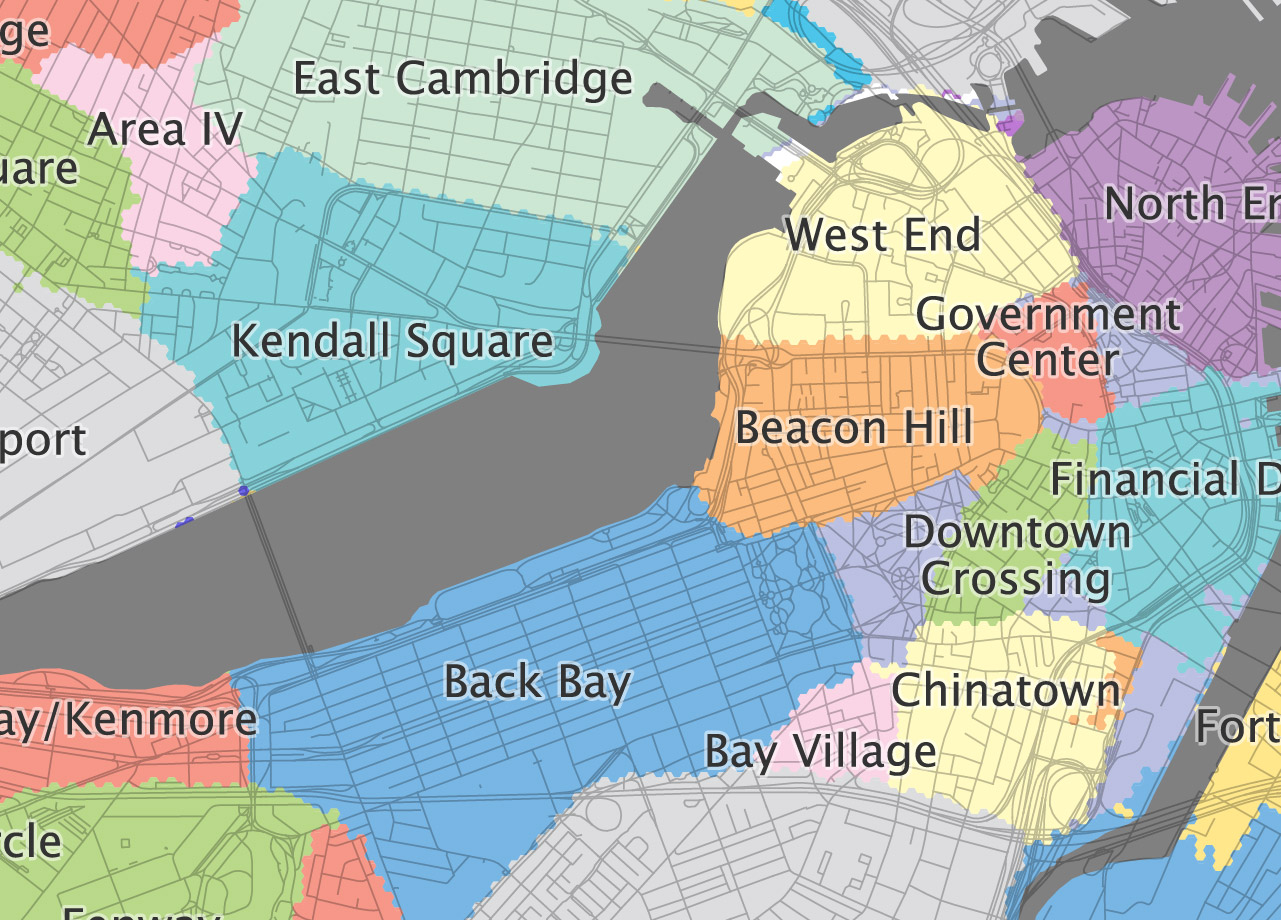
A summary map of polygons representing the area where each neighborhood name is dominant. That is, the area where a given neighborhood name is used more than any other neighborhood name.
Overlay a (hexagonal) grid, and for each cell get all neighborhood polygons overlapping it, then assign to the cell the name that appears most among those polygons. Essentially, this is a raster map.
Is there a way to do this with a more genuine vector approach? My grid is sufficiently fine, but it's still a grid, bumpy and hexagon-y rather than smooth and precise-looking.
You can always re vectorize and simplify or smooth the grid once comeplete.