Created
November 3, 2019 09:37
-
-
Save cavedave/ee07e3bde22e6788723e0173490d501d to your computer and use it in GitHub Desktop.
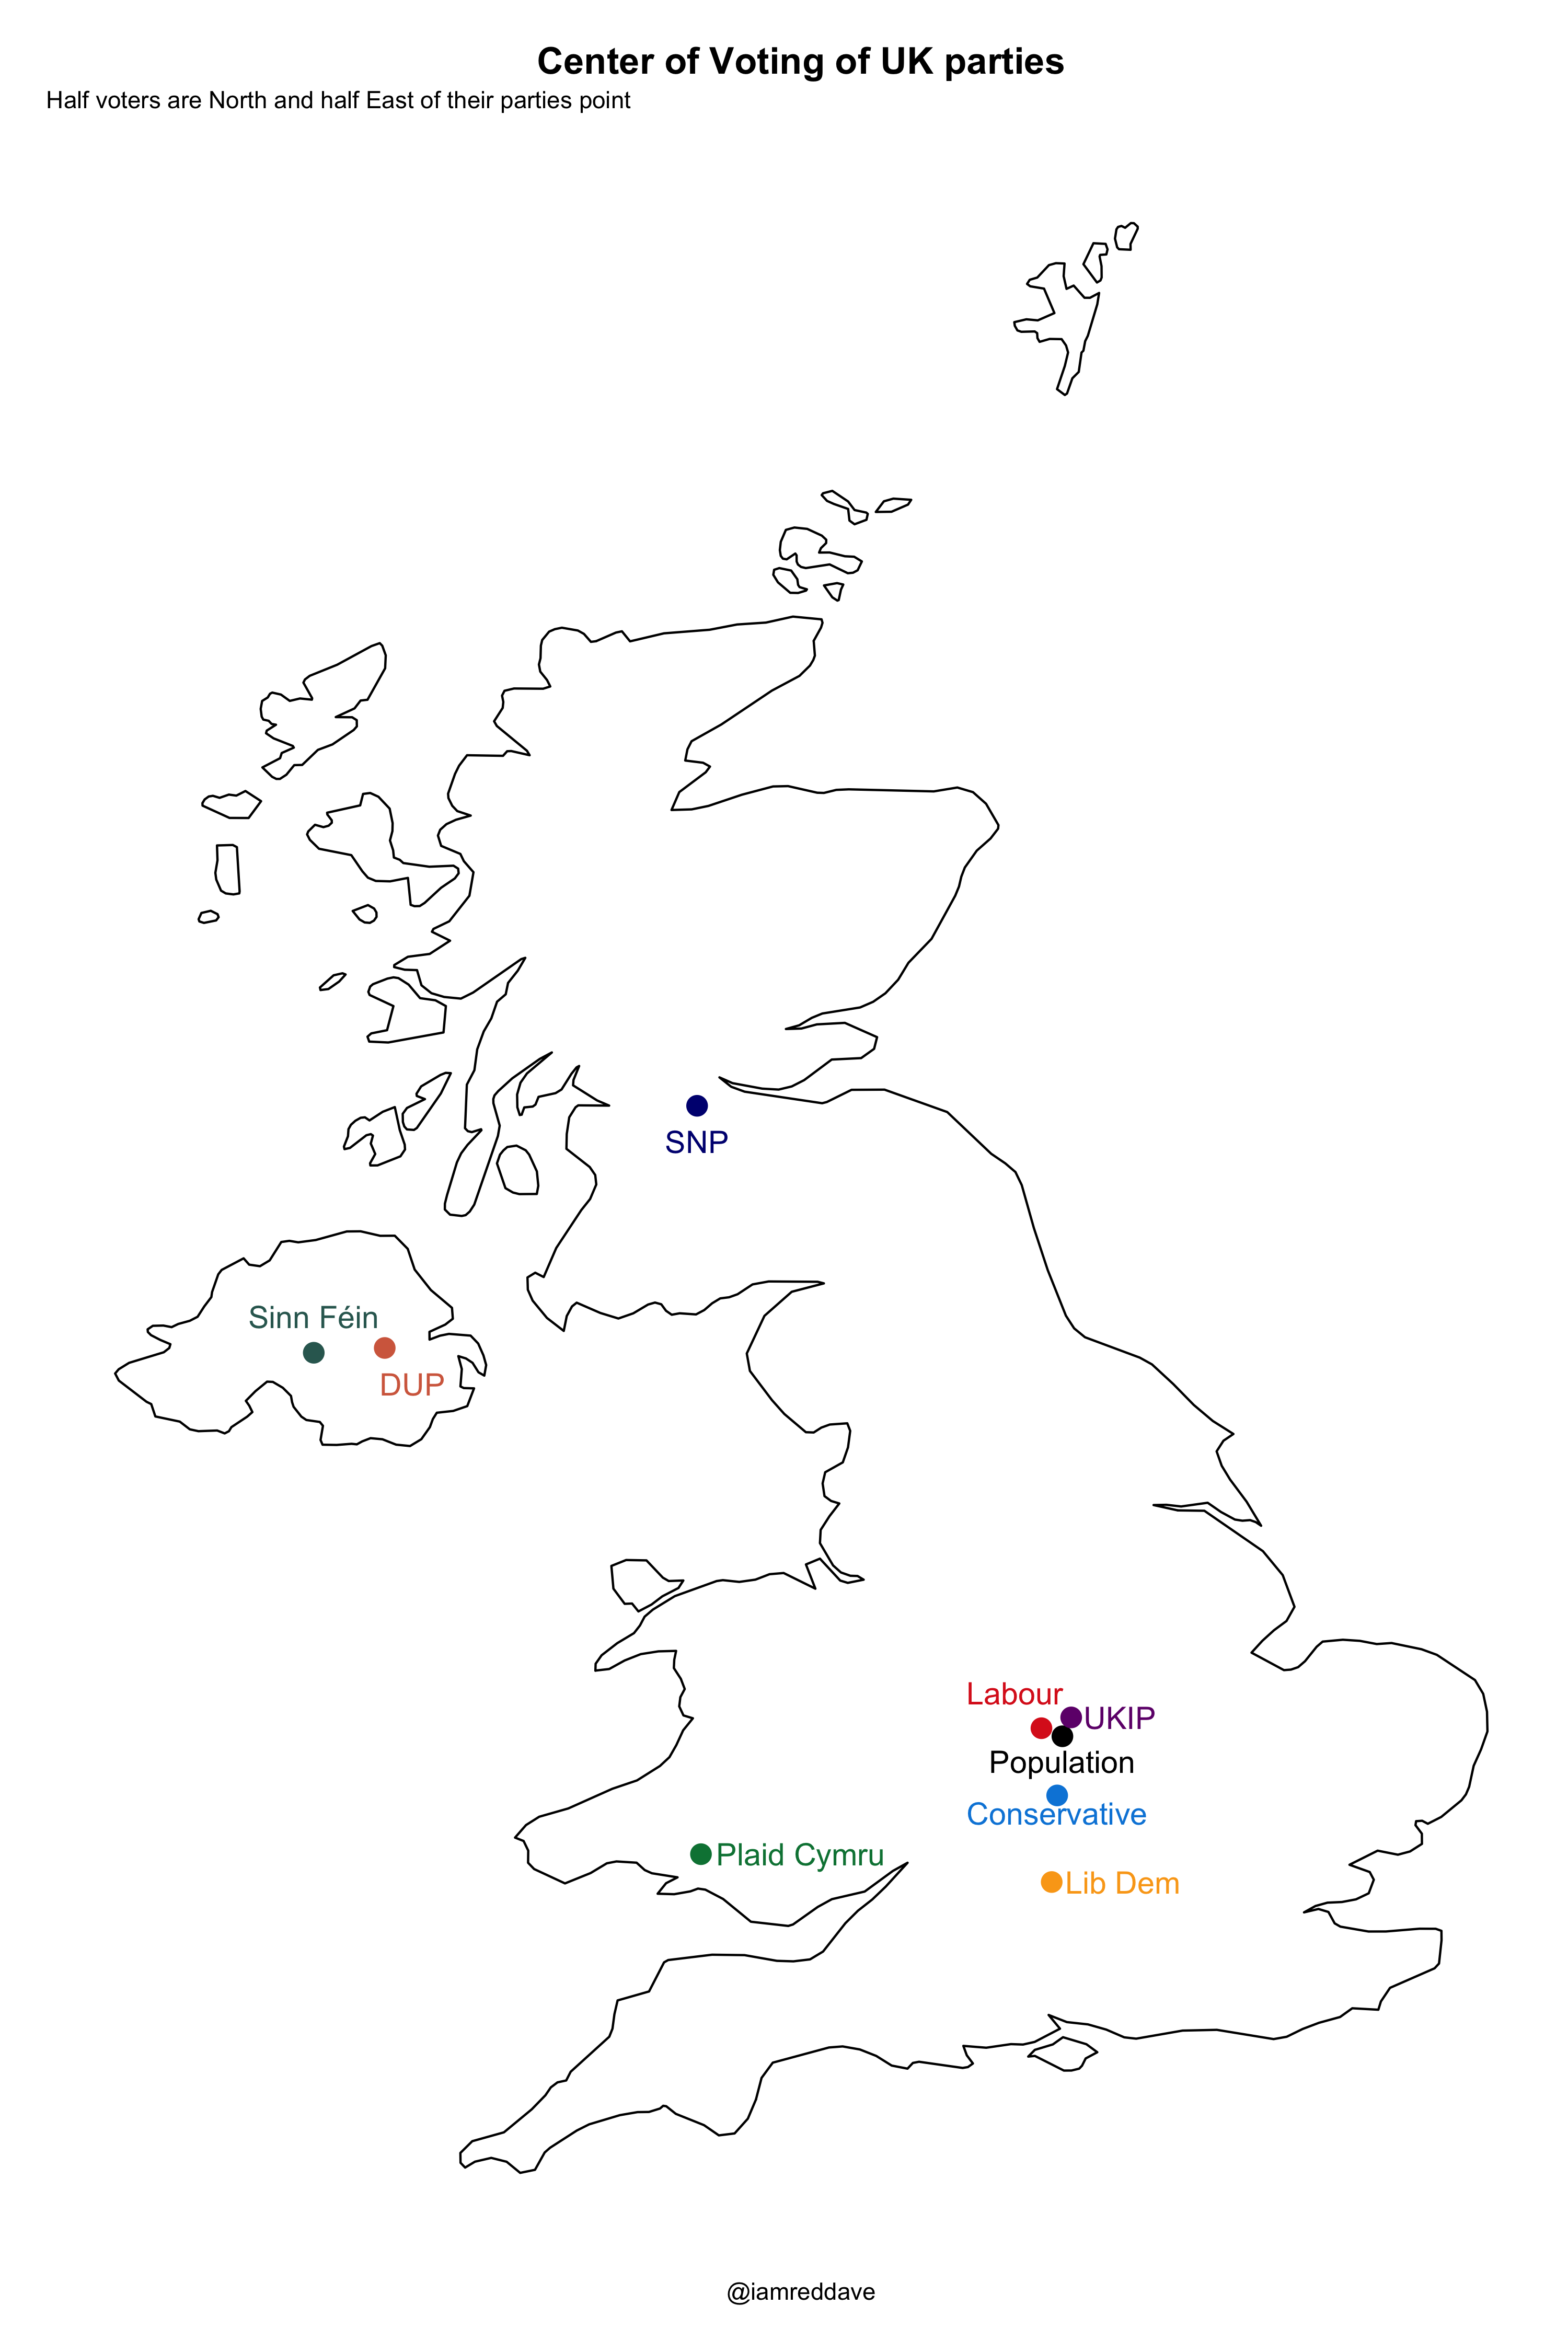
Make a map of where people in the UK vote
This file contains bidirectional Unicode text that may be interpreted or compiled differently than what appears below. To review, open the file in an editor that reveals hidden Unicode characters.
Learn more about bidirectional Unicode characters
| Now start with maps and locations | |
| See if i can get the center of constituencies | |
| data from https://geoportal.statistics.gov.uk/datasets/westminster-parliamentary-constituencies-december-2017-super-generalised-clipped-boundaries-in-the-uk/data | |
| ```{r} | |
| locat<-read_csv("Westminster_Parliamentary_Constituencies_December_2017_Super_Generalised_Clipped_Boundaries_in_the_UK.csv")#, sheet = 2, skip=6 , header=TRUE | |
| head(locat) | |
| ``` | |
| ```{r} | |
| # xls files | |
| election<-read_excel("Current-Parliament-Election-Results.xlsx", sheet = 3) | |
| head(election) | |
| ``` | |
| ```{r} | |
| unique(election$CandidateParty) | |
| ``` | |
| Plaid Cymru | |
| UK Independence Party | |
| Sinn Fein | |
| Democratic Unionist Party | |
| Scottish National Party | |
| Ok this works lets try it with just Conservative candidates | |
| 1 Load everyone in the first node into election | |
| Conservative | |
| Liberal Democrat | |
| Labour | |
| ```{r} | |
| library(tidyverse) | |
| election <- | |
| election %>% | |
| filter(CandidateParty=="UK Independence Party") | |
| head(election) | |
| ``` | |
| Now combine this with the consituency location data above | |
| ```{r} | |
| where<-merge(locat, election, by.x="pcon17nm", by.y="ConstituencyName") | |
| head(where) | |
| ``` | |
| I did this before at https://gist.github.com/cavedave/ed66f1961e144adb14c9898e58b42ff7 | |
| Get total number of Conservative votes | |
| Votes 13147245 | |
| https://en.wikipedia.org/wiki/2017_United_Kingdom_general_election | |
| says 13,636,684 | |
| Labour votes 11042160 | |
| Liberal Democrat 2264797 | |
| Scottish National Party 971555 | |
| DUP 292316 | |
| SF 238915 | |
| Plaid Cymru 160620 | |
| UK Independence Party 575660 | |
| ```{r} | |
| sum(where$Votes) | |
| ``` | |
| Now order by longitude | |
| long | |
| <dbl> | |
| lat | |
| <dbl> | |
| ```{r} | |
| where<-where[order(where$long),] | |
| head(where) | |
| ``` | |
| ```{r} | |
| tail(where) | |
| ``` | |
| ```{r} | |
| thresholdValue <- (575660/2) | |
| #head east until you have counted half the people | |
| where<-where[order(where$long),] | |
| ix <- length(which(cumsum(where$Votes) <= thresholdValue)) | |
| first<-where[ix,]$long | |
| #head east until you have counted half the people | |
| where<-where[order(where$lat),] | |
| iy <- length(which(cumsum(where$Votes) <= thresholdValue)) | |
| second<-where[iy,]$lat | |
| ``` | |
| ```{r} | |
| first | |
| ``` | |
| ```{r} | |
| second | |
| ``` | |
| Conservative -1.3548 52.114 | |
| Labour -1.4682 52.4867 | |
| Liberal Democrat -1.3942 51.6339 | |
| Population in total -1.317, y =52.442 | |
| SNP -3.9501 55.9377 | |
| Liberal Democrats -1.3942 51.6339 | |
| DUP -6.2016 54.595 | |
| SF -6.7131 54.5684 Sinn Féin | |
| PC -3.9222 51.7883 #008142 | |
| Ukip -1.2537 52.3466 70147A | |
| ```{r} | |
| library("ggplot2") | |
| theme_set(theme_bw()) | |
| library("sf") | |
| library(maps) | |
| ``` | |
| ```{r} | |
| library(sf) | |
| library(raster) | |
| library(dplyr) | |
| library(spData) | |
| #library(spDataLarge) | |
| ``` | |
| ```{r} | |
| library(tmap) # for static and interactive maps | |
| library(leaflet) # for interactive maps | |
| library(mapview) # for interactive maps | |
| library(ggplot2) # tidyverse data visualization package | |
| library(shiny) # for web applications | |
| ``` | |
| ```{r} | |
| library(ggplot2) | |
| library(ggmap) | |
| library(maps) | |
| library(mapdata) | |
| ``` | |
| ```{r} | |
| usa <- map_data(map = "world", region = "UK") | |
| p<-ggplot() + | |
| geom_polygon(data = usa, aes(x=long, y = lat, group = group), fill = NA, color = "black") + | |
| coord_fixed(1.3)+ | |
| # Conservative -1.3548 52.114 | |
| annotate("point", x = -1.3548, y =52.114, colour = "#0087DC", size = 4)+ | |
| annotate(geom="text", x = -1.3548, y =52.014, label="Conservative",color="#0087DC",size = 5)+ | |
| #Labour -1.4682 52.4867 | |
| annotate("point", x = -1.4682, y =52.4867, colour = "#DC241f", size = 4)+ | |
| annotate(geom="text", x=-1.6582, y=52.682, label="Labour", | |
| color="#DC241f",size = 5)+ | |
| #Liberal Democrat -1.3942 51.6339 | |
| annotate("point", x = -1.3942, y =51.6339, colour = "#FAA61A", size = 4)+ | |
| annotate(geom="text", x=-.88042, y =51.6339, label="Lib Dem", | |
| color="#FAA61A",size = 5)+ | |
| #Population in total -1.317, y =52.442 | |
| annotate("point", x = -1.317, y =52.442, colour = "black", size = 4)+ | |
| annotate(geom="text", x=-1.317, y=52.302, label="Population", | |
| color="black",size = 5)+ | |
| #snp -3.9501 55.9377 | |
| annotate("point", x = -3.9501, y =55.9377, colour = "navy", size = 4)+##FDF38E | |
| annotate(geom="text", x=-3.950, y=55.7377, label="SNP", | |
| color="navy",size = 5)+ | |
| #DUP -6.2016 54.595 | |
| annotate("point", x = -6.2016, y =54.595, colour = "#D46A4C", size = 4)+ | |
| annotate(geom="text", x=-6.0016, y=54.395, label="DUP", | |
| color="#D46A4C",size = 5)+ | |
| #SF -6.7131 54.5684 Sinn Féin | |
| annotate("point", x = -6.7131, y =54.5684, colour = "#326760", size = 4)+ | |
| annotate(geom="text", x=-6.7131, y=54.7684, label="Sinn Féin", | |
| color="#326760",size = 5)+ | |
| #PC -3.9222 51.7883 #008142 | |
| annotate("point", x = -3.9222, y =51.7883, colour = "#008142", size = 4)+ | |
| annotate(geom="text", x = -3.2022, y =51.7883, label="Plaid Cymru", | |
| color="#008142",size = 5)+ | |
| #Ukip -1.2537 52.3466 70147A | |
| annotate("point", x = -1.2537, y =52.5466, colour = "#70147A", size = 4) + | |
| annotate(geom="text", x=-0.9037, y=52.5466, label="UKIP", | |
| color="#70147A",size = 5)+ | |
| #theme(plot.title = element_text(size=22),plot.title = element_text(hjust = 0.5)) | |
| theme_classic()+ | |
| theme(line = element_blank(), | |
| #text = element_blank(), | |
| axis.text.x=element_blank(), | |
| axis.ticks.x=element_blank(), | |
| axis.text.y =element_blank(), | |
| axis.ticks.y=element_blank(), | |
| plot.title = element_text(size = 17, face = "bold",hjust = 0.5))+ | |
| ggtitle("Center of Voting of UK parties", | |
| subtitle = "Half voters are North and half East of thier parties point")+ | |
| ggsave("VotingCentre.png",height=15, width=10) | |
| p | |
| ``` |
Author
cavedave
commented
Nov 3, 2019
Sign up for free
to join this conversation on GitHub.
Already have an account?
Sign in to comment