Skip to content

Instantly share code, notes, and snippets.

@eesur
Last active May 23, 2017 11:01
Show Gist options
  • Star 0 You must be signed in to star a gist
  • Fork 0 You must be signed in to fork a gist
  • Save eesur/fd911217f6bb7ff3458edaa771b78037 to your computer and use it in GitHub Desktop.
Save eesur/fd911217f6bb7ff3458edaa771b78037 to your computer and use it in GitHub Desktop.
d3 | Morphological Table 1
var data = [
{ // 0
ref: 'h1', // top horizontal line
x1: 0, y1: 0, // use 0 for start, 0.5 for midway, and 1 for end
x2: 1, y2: 0,
},
{ // 1
ref: 'h2', // mid horizontal line
x1: 0, y1: 0.5,
x2: 1, y2: 0.5,
},
{ // 2
ref: 'h3', // end horizontal line
x1: 0, y1: 1,
x2: 1, y2: 1,
},
{ // 3
ref: 'v1', // left vertical line
x1: 0, y1: 0,
x2: 0, y2: 1,
},
{ // 4
ref: 'v2', // mid vertical line
x1: 0.5, y1: 0,
x2: 0.5, y2: 1,
},
{ // 5
ref: 'v3', // right vertical line
x1: 1, y1: 0,
x2: 1, y2: 1,
} ]
// filter to display morphings
var dataMorpingCombinations = [
[0, 3], // A1
[2, 3], // A2
[0, 2, 3], // A3
[1, 3], // A4
[0, 1, 3], // A5
[1, 2, 3], // A6
[0, 1, 2, 3], // A7
[0, 5], // B1
[2, 5], // B2
[0, 2, 5], // B3
[1, 5], // B4
[0, 1, 5], // B5
[1, 2, 5], // B6
[0, 1, 2, 5], // B7
[0, 3, 5], // C1
[2, 3, 5], // C2
[0, 2, 3, 5], // C3
[1, 3, 5], // C4
[0, 1, 3, 5], // C5
[1, 2, 3, 5], // C6
[0, 1, 2, 3, 5], // C7
[0, 4], // D1
[2, 4], // D2
[0, 2, 4], // D3
[1, 4], // D4
[0, 1, 4], // D5
[1, 2, 4], // D6
[0, 1, 2, 4], // D7
[0, 3, 4], // E1
[2, 3, 4], // E2
[0, 2, 3, 4], // E3
[1, 3, 4], // E4
[0, 1, 3, 4], // E5
[1, 2, 3, 4], // E6
[0, 1, 2, 3, 4], // E7
[0, 4, 5], // F1
[2, 4, 5], // F2
[0, 2, 4, 5], // F3
[1, 4, 5], // F4
[0, 1, 4, 5], // F5
[1, 2, 4, 5], // F6
[0, 1, 4, 5], // F7
[0, 3, 4, 5], // G1
[2, 3, 4, 5], // G2
[0, 2, 3, 4, 5], // G3
[1, 3, 4, 5], // G4
[0, 1, 3, 4, 5], // G5
[1, 2, 3, 4, 5], // G6
[0, 1, 2, 3, 4, 5] // G7
]
// map the morphings above with the data to draw lines
var dataMorp = dataMorpingCombinations.map(function(nested) {
return nested.map(function(d) {
return data[d]
})
})
var svg = d3.select('#vis')
var lineScale = d3.scaleLinear()
.domain([0, 1])
.range([0, 400])
function render(data) {
var update = svg.selectAll('line')
.data(data, function(d){
return d.ref
})
var enter = update.enter()
.append('line')
enter.merge(enter)
.attr('x1', function (d) { return lineScale(d.x1); })
.attr('y1', function (d) { return lineScale(d.y1); })
.attr('x2', function (d) { return lineScale(d.x2); })
.attr('y2', function (d) { return lineScale(d.y2); })
update.exit().remove()
}
function nav(data, n) {
// track if a btn is clicked
var activeState = false
// append some buttons
d3.select('header')
.append('nav').append('ul')
.attr('class', 'list-reset')
.selectAll('.btn')
.data(d3.range(n))
.enter().append('li')
.attr('class', function (d) { return ("inline-block center btn btn-" + (d +1)); })
.on('mouseover', function hover(d, i) {
render(data[i])
})
.on('click', function click(d, i, e) {
// update the state of buttons
activeState = (activeState) ? false : true
console.log('activeState', activeState)
// allow users to toggle button
if (activeState) {
d3.selectAll(e)
// filter out all but `this` one
.filter(function (d) { return d !== i; }) // `i` is form the `click` function
// using a css selector would also have worked:
// .filter(':not(:hover)')
.style('pointer-events', 'none')
.style('opacity', 0.2)
render(data[i])
} else { // reset
d3.selectAll(e)
.style('pointer-events', 'auto')
.style('opacity', 1)
}
})
.text(function (d) { return d+1; })
}
// render the nav and the lines
nav(dataMorp, 49)
render(data)

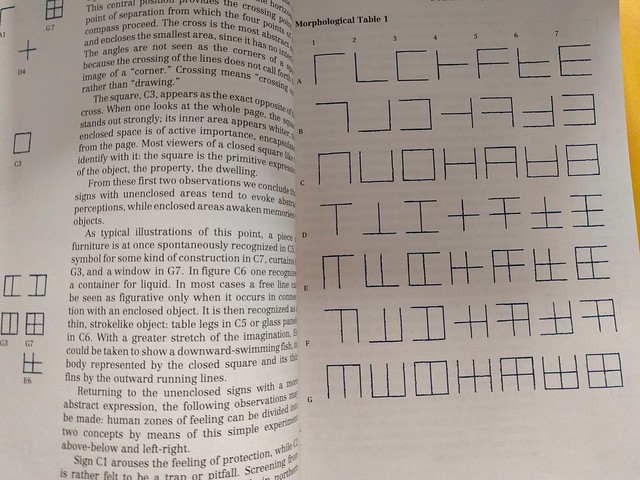
This sketch is inspired from reading the amazing typographer Adrian Frutiger writings on morphology of signs and his first example table, Morphological Table 1.

The viewer's attitude toward a figure is very complex. In order to understand the procedure of taking in the meaning it is necessary to begin with a diagram with simple divisions, ... The diagram figures are built up from three vertical and three horizontal lines, which, when superimposed, alternately touch, cross, and supplement one another. Mathematically, 49 variants (7*7) can be produced with these six strokes. We call this procedure the completion of a program, seeking out all the possibilities contained in a given structure

[source: p.33 Signs and Symbols: Their Design and Meaning, Adrian Frutiger]

book image

notes:

  • d3 code is generating all the buttons
  • the user can both hover for quick viewing and click to hold the view (which can be toggled off) using pointer-events
  • the 49 views are drawn from filtering the data
<!DOCTYPE html>
<html lang="en">
<head>
<meta charset="utf-8">
<!-- http://www.basscss.com/ -->
<link href="//npmcdn.com/basscss@8.0.2/css/basscss.min.css" rel="stylesheet">
<style>
body {
font-family: Consolas, monaco, monospace;
background: #130C0E;
color: #FFF;
}
line {
stroke-width: 8;
stroke: #FDBB30;
stroke-linecap: square;
}
ul {
color: #130C0E;
/*font-size: 13px;*/
}
li {
/*padding: 2px 8px;*/
margin-right: 1px;
margin-left: 1px;
width: 40px;
height: 20px;
background: #FDBB30;
}
li:hover {
background: #130C0E;
color: #FDBB30;
cursor: none;
}
</style>
</head>
<body>
<main class="max-width-4 mx-auto">
<header class="pl1">
<p>Morphological Table 1 [Adrian Frutiger, Signs and Symbols]</p>
</header>
<section class="center py4">
<svg width="500" height="500">
<g id="vis" transform="translate(20, 20)"></g>
</svg>
</section>
</main>
<script src="//d3js.org/d3.v4.min.js" charset="utf-8"></script>
<!-- d3 code -->
<script src=".script-compiled.js" charset="utf-8"></script>
<!-- render code -->
<script>
d3.select(self.frameElement).style('height', '780px');
</script>
</body>
</html>
const data = [
{ // 0
ref: 'h1', // top horizontal line
x1: 0, y1: 0, // use 0 for start, 0.5 for midway, and 1 for end
x2: 1, y2: 0,
},
{ // 1
ref: 'h2', // mid horizontal line
x1: 0, y1: 0.5,
x2: 1, y2: 0.5,
},
{ // 2
ref: 'h3', // end horizontal line
x1: 0, y1: 1,
x2: 1, y2: 1,
},
{ // 3
ref: 'v1', // left vertical line
x1: 0, y1: 0,
x2: 0, y2: 1,
},
{ // 4
ref: 'v2', // mid vertical line
x1: 0.5, y1: 0,
x2: 0.5, y2: 1,
},
{ // 5
ref: 'v3', // right vertical line
x1: 1, y1: 0,
x2: 1, y2: 1,
},
]
// filter to display morphings
const dataMorpingCombinations = [
[0, 3], // A1
[2, 3], // A2
[0, 2, 3], // A3
[1, 3], // A4
[0, 1, 3], // A5
[1, 2, 3], // A6
[0, 1, 2, 3], // A7
[0, 5], // B1
[2, 5], // B2
[0, 2, 5], // B3
[1, 5], // B4
[0, 1, 5], // B5
[1, 2, 5], // B6
[0, 1, 2, 5], // B7
[0, 3, 5], // C1
[2, 3, 5], // C2
[0, 2, 3, 5], // C3
[1, 3, 5], // C4
[0, 1, 3, 5], // C5
[1, 2, 3, 5], // C6
[0, 1, 2, 3, 5], // C7
[0, 4], // D1
[2, 4], // D2
[0, 2, 4], // D3
[1, 4], // D4
[0, 1, 4], // D5
[1, 2, 4], // D6
[0, 1, 2, 4], // D7
[0, 3, 4], // E1
[2, 3, 4], // E2
[0, 2, 3, 4], // E3
[1, 3, 4], // E4
[0, 1, 3, 4], // E5
[1, 2, 3, 4], // E6
[0, 1, 2, 3, 4], // E7
[0, 4, 5], // F1
[2, 4, 5], // F2
[0, 2, 4, 5], // F3
[1, 4, 5], // F4
[0, 1, 4, 5], // F5
[1, 2, 4, 5], // F6
[0, 1, 4, 5], // F7
[0, 3, 4, 5], // G1
[2, 3, 4, 5], // G2
[0, 2, 3, 4, 5], // G3
[1, 3, 4, 5], // G4
[0, 1, 3, 4, 5], // G5
[1, 2, 3, 4, 5], // G6
[0, 1, 2, 3, 4, 5] // G7
]
// map the morphings above with the data to draw lines
let dataMorp = dataMorpingCombinations.map(function(nested) {
return nested.map(function(d) {
return data[d]
})
})
const svg = d3.select('#vis')
const lineScale = d3.scaleLinear()
.domain([0, 1])
.range([0, 400])
function render(data) {
const update = svg.selectAll('line')
.data(data, function(d){
return d.ref
})
const enter = update.enter()
.append('line')
enter.merge(enter)
.attr('x1', d => lineScale(d.x1))
.attr('y1', d => lineScale(d.y1))
.attr('x2', d => lineScale(d.x2))
.attr('y2', d => lineScale(d.y2))
update.exit().remove()
}
function nav(data, n) {
// track if a btn is clicked
let activeState = false
// append some buttons
d3.select('header')
.append('nav').append('ul')
.attr('class', 'list-reset')
.selectAll('.btn')
.data(d3.range(n))
.enter().append('li')
.attr('class', d => `inline-block center btn btn-${d +1}`)
.on('mouseover', function hover(d, i) {
render(data[i])
})
.on('click', function click(d, i, e) {
// update the state of buttons
activeState = (activeState) ? false : true
console.log('activeState', activeState)
// allow users to toggle button
if (activeState) {
d3.selectAll(e)
// filter out all but `this` one
.filter(d => d !== i) // `i` is form the `click` function
// using a css selector would also have worked:
// .filter(':not(:hover)')
.style('pointer-events', 'none')
.style('opacity', 0.2)
render(data[i])
} else { // reset
d3.selectAll(e)
.style('pointer-events', 'auto')
.style('opacity', 1)
}
})
.text(d => d+1)
}
// render the nav and the lines
nav(dataMorp, 49)
render(data)
Sign up for free to join this conversation on GitHub. Already have an account? Sign in to comment