Charty - Visualizing your data in Ruby
(Overview of Charty)
https://raw.githubusercontent.com/red-data-tools/charty/master/images/design_concept.png
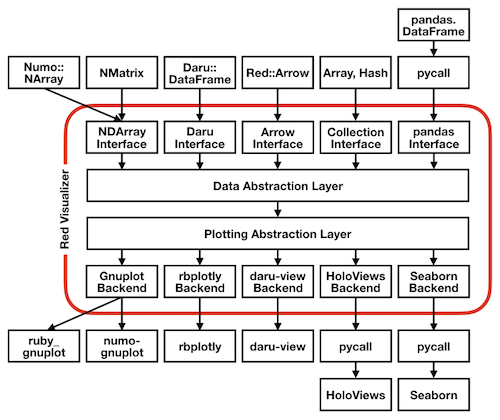
To summarize, the objectives of the Charty project are as follows:
- Create a thin Ruby library that can use the GR framework as an independent backend.
- Enable GR framework as backend from Charty (use SciRuby/rubyplot as the visualization layer)
- Implements Collection Interface corresponding to Charty's Data Abstraction Layer.
- Implement Daru Interface corresponding to Charty's Data Abstraction Layer.
Currently I'm communicating on the SciRuby forum and I'm planning to use SciRuby/rubyplot as Charty's Plotting Abstraction Layer. Therefore, in this project, we aim to cooperate with rubyplot and to expand Data Abstraction Layer.
- https://github.com/SciRuby/rubyplot
- Possible collaboration between sciruby and red-data-tools for visualization in Ruby - Google Groups
Charty is open-source Ruby library for visualizing your data in a simple way. In Charty, you need to write very few lines of code for representing what you want to do. It lets you focus on your analysis of data, instead of plotting.
https://github.com/red-data-tools/charty
- Nov, 2018
- Development start
- Jan, 2019
- Develop the above 3 and 4 and prepare Charty's Data Abstraction Layer
- Interim report
- Mar, 2019
- Develop the above 3 and 4 and make Charty's Data Abstraction Layer
- Final report
Develop the above 1 - 4 and update this repository