Though we're focused more on server setup procedure in this document, I will still give a very brief explanation in laymen terms for ELK. To those who are starting new in this stack, must have already heard of MVC (Model View Controller), so take it like this:
- Model
=>Elasticsearch (for Storage, Indexing & Search) - View
=>Kibana (for DataViz & G-Man, yeah the one in half life 😏) - Controller
=>Logstash (For Logs & Filtering)
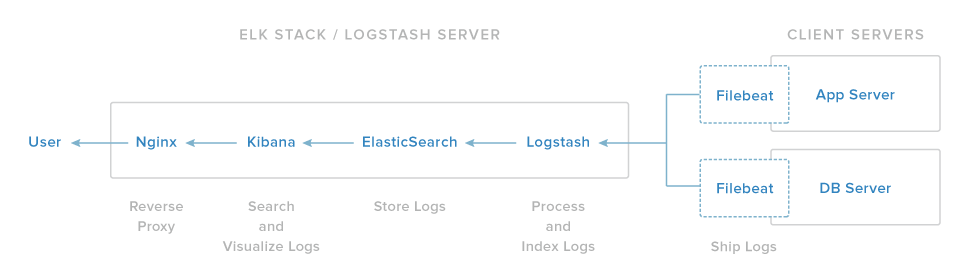
Our ELK stack setup has four main components:
- Logstash: The server component of Logstash that processes incoming logs
- Elasticsearch: Stores all of the logs
- Kibana: Web interface for searching and visualizing logs, which will be proxied through Nginx
- Filebeat: Installed on client servers that will send their logs to Logstash, Filebeat serves as a log shipping agent that utilizes the lumberjack networking protocol to communicate with Logstash
These are the versions we are currently setting up in this installment, please make note accordingly if you have specific version requirements.
JDK Version - 8
Elasticsearch - 2.x
Logstash - 2.2
Kibana - 4.5
For production go with three separate instances for each, elasticsearch, logstash and kibana. Currently we are setting it up on a single machine. You can opt for similar configuration on any cloud provider.
OS  - Ubuntu 14.04 LTS
RAM - 4Gb
CPU - 2
The amount of CPU, RAM, and storage that your ELK Server will require depends on the volume of logs that you intend to gather.
####AWS Canonical have recently stopped support for smaller instances and hence you can't pick one from above configuration, so here is a workaround for that (only appreciated in test env) 😉
- Go to the following link
- Enter the instance ID
ami-d05e75b8in the search and once search populated, tap on the value of last columnIDof table, which contains same AMI ID. - The next page you will land on is on AWS EC2 select instance type with all enabled.
####0 - Preliminary (skip if already done)
$ sudo apt-get update$ sudo apt-get upgrade
####1 - Java 8 Installation
-
Add Oracle Java PPA to apt:
$ sudo add-apt-repository -y ppa:webupd8team/java
-
Update your apt package database:
$ sudo apt-get update
-
Install the latest version of Oracle Java 8
$ sudo apt-get -y install oracle-java8-installer
-
Check Java installation
$ java -version
####2 - Elasticsearch Installation
-
Import Elasticsearch public GPG key into apt
$ wget -qO - https://packages.elastic.co/GPG-KEY-elasticsearch | sudo apt-key add -
-
Create the Elasticsearch source list
$ echo "deb http://packages.elastic.co/elasticsearch/2.x/debian stable main" | sudo tee -a /etc/apt/sources.list.d/elasticsearch-2.x.list
-
Update your package database
$ sudo apt-get update
-
Install Elasticsearch
$ sudo apt-get -y install elasticsearch
-
Start Elasticsearch service
$ sudo service elasticsearch restart
-
Test
$ curl localhost:9200
-
If the output is similar to this, then you will know that Elasticsearch is running properly:
{
  "status" : 200,
  "name" : "Nuke - Frank Simpson",
  "cluster_name" : "elasticsearch",
  "version" : {
    "number" : "1.7.5",
    "build_hash" : "00f95f4ffca6de89d68b7ccaf80d148f1f70e4d4",
    "build_timestamp" : "2016-02-02T09:55:30Z",
    "build_snapshot" : false,
    "lucene_version" : "4.10.4"
  },
  "tagline" : "You Know, for Search"
}- Enable Elasticsearch to start on boot
$ sudo update-rc.d elasticsearch defaults 95 10
Production tip: DO NOT open any other ports, like 9200, to the world! There are many bots that search for 9200 and execute groovy scripts to overtake machines.
####3 - Logstash Installation
-
The Logstash package is available from the same repository as Elasticsearch, and public key is already installed, so let's create the Logstash source list:
$ echo 'deb http://packages.elastic.co/logstash/2.2/debian stable main' | sudo tee /etc/apt/sources.list.d/logstash-2.2.x.list
-
Update apt package database:
$ sudo apt-get update
-
Install Logstash
$ sudo apt-get install logstash
-
Enable start on boot
$ sudo update-rc.d logstash defaults 97 8
-
Run service logstash
$ sudo service logstash start
-
We have yet to configure Logstash, but let leave it for later.
####4 - Kibana Installation
-
Download and install the Public Signing Key
$ wget -qO - https://packages.elastic.co/GPG-KEY-elasticsearch | sudo apt-key add -
-
Add the repository definition to your
/etc/apt/sources.list.d/kibana.listfile$ echo "deb http://packages.elastic.co/kibana/4.5/debian stable main" | sudo tee -a /etc/apt/sources.list
WARNING
Use the echo method described above to add the Kibana repository. Do not use add-apt-repository, as that command adds a deb-src entry with no corresponding source package. When the deb-src entry, is present, the commands in this procedure generate an error similar to the following:

Unable to find expected entry 'main/source/Sources' in Release file (Wrong sources.list entry or malformed file)
Delete the deb-src entry from the /etc/apt/sources.list.d/kibana.list file to clear the error.
-
Update apt and install Kibana
$ sudo apt-get update && sudo apt-get install kibana
-
Open Kibana configuration file for editing
$ sudo vi /opt/kibana/config/kibana.yml
-
In the Kibana configuration file, find the line that specifies server.host, uncomment and replace the IP address ("0.0.0.0" by default) with "localhost":
server.host: "localhost"- Save and exit. This setting makes it so Kibana will only be accessible to the localhost. This is fine because we will use an Nginx reverse proxy to allow external access.
-
Enable start on boot
$ sudo update-rc.d kibana defaults 95 10
-
Start service Kibana
$ sudo service kibana start
-
Before we can use the Kibana web interface, we have to set up a reverse proxy. Let's do that now, with Nginx.
####3 - Nginx Installation Note: If you already have an Nginx instance that you want to use, feel free to use that instead. Just make sure to configure Kibana so it is reachable by your Nginx server (you probably want to change the host value, in /opt/kibana/config/kibana.yml, to your Kibana server's private IP address or hostname). Also, it is recommended that you enable SSL/TLS.
-
Install Nginx and Apt-utils
$ sudo apt-get install nginx apache2-utils
-
Create an admin user and assign password to it
$ sudo htpasswd -c /etc/nginx/htpasswd.users kibanaadmin
-
Now open the nginx default server block
$ sudo vim /etc/nginx/sites-available/default
-
Delete the file's contents, and paste the following code block into the file.
server {
  listen 80;
    server_name kibana;


  error_log   /var/log/nginx/kibana.error.log;
  access_log  /var/log/nginx/kibana.access.log;


  location / {
    rewrite ^/(.*) /$1 break;
    proxy_ignore_client_abort on;
    proxy_pass http://localhost:5601;
    proxy_set_header  X-Real-IP  $remote_addr;
    proxy_set_header  X-Forwarded-For $proxy_add_x_forwarded_for;
    proxy_set_header  Host $http_host;

  }
}
-
Save and exit. This configures Nginx to direct your server's HTTP traffic to the Kibana application, which is listening on
localhost:5601. -
Now restart Nginx to reflect your changes
$ sudo service nginx restart
-
Kibana is now accessible via your FQDN or the public IP address of your ELK Server i.e.
http://elk\_server\_public\_ip/
How about putting Logstash behind a proxy? It wont work using the same logic with Kibana. Something about being a TCP protocol or something.