Created
December 6, 2022 04:41
-
-
Save MattCowgill/29c3251bfacc5828c2c8b1f554abbe97 to your computer and use it in GitHub Desktop.
This file contains bidirectional Unicode text that may be interpreted or compiled differently than what appears below. To review, open the file in an editor that reveals hidden Unicode characters.
Learn more about bidirectional Unicode characters
| library(tidyverse) | |
| library(ggdirectlabel) # remotes::install_github("MattCowgill/ggdirectlabel") | |
| library(readabs) | |
| read_lfs_datacube <- function(cube, | |
| catalogue_string = "labour-force-australia-detailed", | |
| update_date = Sys.Date()) { | |
| file <- download_abs_data_cube( | |
| catalogue_string = catalogue_string, | |
| cube = cube | |
| ) | |
| file |> | |
| readxl::read_excel( | |
| sheet = "Data 1", | |
| skip = 3 | |
| ) |> | |
| rename(date = 1) |> | |
| janitor::clean_names() |> | |
| mutate(date = as.Date(date)) | |
| } | |
| lf_uq2a <- read_lfs_datacube("UQ2a") | |
| unemp_by_reason <- lf_uq2a |> | |
| filter(date >= ymd("2002-01-01")) |> | |
| group_by(date, reason = reason_left_or_lost_last_job) |> | |
| summarise(unemployed = sum(unemployed_looked_for_full_time_work_000 + | |
| unemployed_looked_for_only_part_time_work_000)) |> | |
| ungroup() | |
| unemp_by_reason |> | |
| filter(reason %in% c( | |
| "Left last job", | |
| "Lost last job" | |
| )) |> | |
| ggplot(aes(x = date, y = unemployed, col = reason)) + | |
| geom_linepoint() + | |
| ggrepel::geom_text_repel( | |
| data = ~ filter(., date == max(date)), | |
| aes(label = paste0( | |
| reason, "\n", | |
| round(unemployed, 0), "k" | |
| )), | |
| direction = "y", | |
| hjust = 0, | |
| nudge_x = 180, | |
| size = 13 / .pt, | |
| family = "Roboto Condensed" | |
| ) + | |
| theme_minimal(base_size = 18, | |
| base_family = "Roboto Condensed") + | |
| scale_y_continuous( | |
| limits = \(x) c(0, x[2]), | |
| labels = \(x) paste0(x, "k"), | |
| expand = expansion(c(0, 0.05)) | |
| ) + | |
| scale_x_date( | |
| expand = expansion(c(0, 0.2)), | |
| breaks = seq( | |
| max(unemp_by_reason$date), | |
| min(unemp_by_reason$date), | |
| "-5 years" | |
| ), | |
| date_labels = "%b\n%Y" | |
| ) + | |
| theme( | |
| axis.title = element_blank(), | |
| axis.line.x = element_line(), | |
| panel.grid.minor = element_blank(), | |
| legend.position = "none", | |
| plot.title.position = "plot", | |
| plot.caption.position = "plot", | |
| plot.caption = element_text(hjust = 0, | |
| face = "italic", | |
| size = 8) | |
| ) + | |
| labs( | |
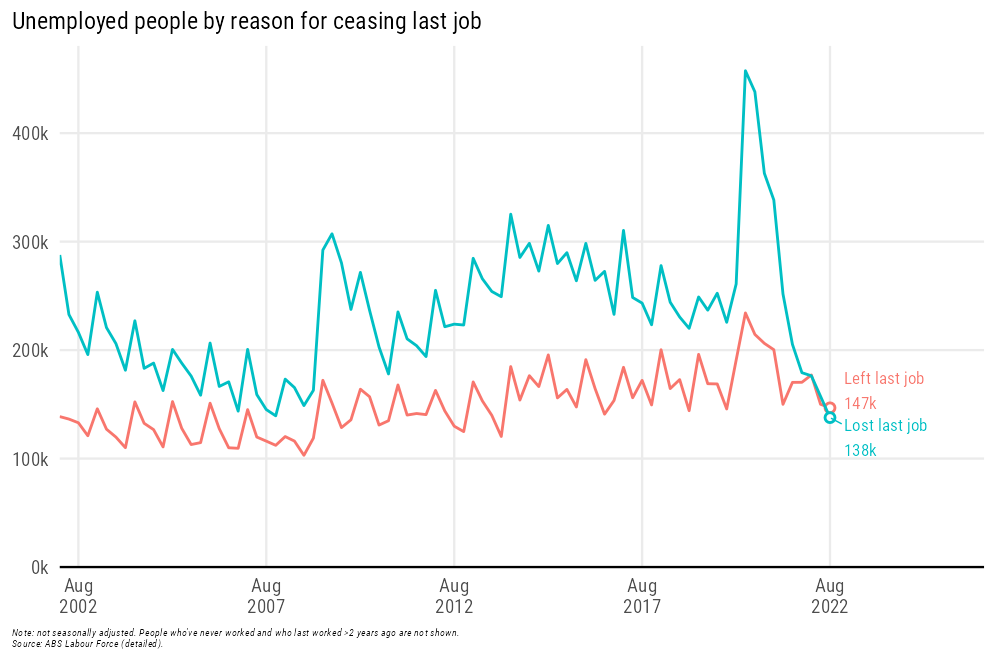
| caption = "Note: not seasonally adjusted. People who've never worked and who last worked >2 years ago are not shown.\nSource: ABS Labour Force (detailed).", | |
| subtitle = "Unemployed people by reason for ceasing last job" | |
| ) |
Author
MattCowgill
commented
Dec 6, 2022
Sign up for free
to join this conversation on GitHub.
Already have an account?
Sign in to comment