| Field | Value |
|---|---|
| Project Title | Raster Awareness in PySAL |
| Project Link | https://summerofcode.withgoogle.com/projects/#5775104799145984 |
| Organization | NumFOCUS (Sub-Org: PySAL) |
| Mentors | Stefanie Lumnitz, Dani Arribas-Bel, Levi John Wolf |
| Contributed Repo | libpysal, splot |
| Working Repo | Mgeeeek/libpysal |
| Gitter Room | https://gitter.im/GSoC2020-PySAL/Raster_awareness_in_PySAL |
| Project Blog | https://mgeeeek.github.io/tags/gsoc/ |
From early on, PySAL was designed with the focus of performing vector-based spatial analysis and therefore it didn't have the tools to handle the input-output of large raster data. This restricted some folks in the geospatial community to use PySAL's analytical functionality over raster data. Furthermore, in recent years several geographic data organizations started releasing data in raster format which earlier came in vector format mostly because of advancement in computational capabilities and high storage availability. This led to an increase in the demand for the functionality offered by PySAL to make it work with raster data.
Taking this into consideration, my main motive was to design and implement a lightweight interface which will provide the functionality for streamlining raster data access and making it more accessible to build the data structure accepted by the analytical methods of the PySAL library (mainly libpysal.weights.W/WSP objects) from accessed raster data (which will be an instance of xarray.DataArray). Ultimately, this functionality will open up the use of analytical methods like esda, spatial regression over raster data.
Following were the major milestones that we planned to achieve for successfully building raster interface:
- Design quality APIs which followed existing structure used across PySAL.
- Deal with different properties of raster including missing data values, different data alignment, and multi-layer data.
- Add transformational methods to support conversion to and from PySAL weights object and
xarray.DataArrayobject. - Integrate the interface with PySAL without causing any disturbance to other parts of the library.
- Study performance and memory efficiency of the conversion methods and optimize the interface to support computations for large raster datasets.
- Add proper documentation, tests, and an example notebook.
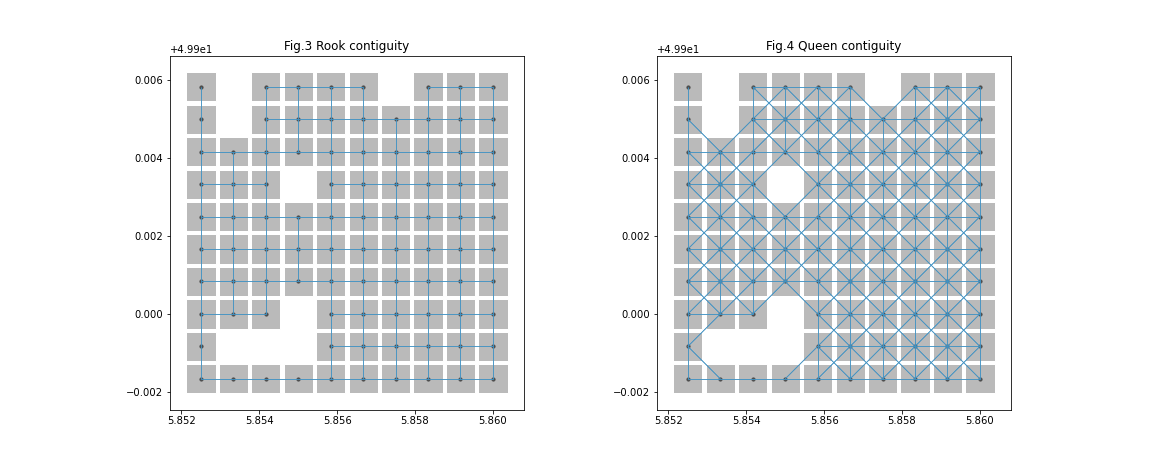
Since in this report we'll talk a lot about raster data and weights object, let's look at the visualization of these 2 things. Weights object in PySAL is a graph like structure which expresses the relationship of a spatial point with its neighboring points, whereas we can think of a raster as an n-d array. We can now take a look at the visual example below:

 Here,
Here, fig. 1 represents the original raster dataset which was then used to derive the sliced raster shown in fig. 2. Furthermore, we can see 2 plots of weights objects which are represented by fig. 3 and fig. 4. These weights objects were obtained using the sliced raster. We can see how the relationship of spatial points is different in Rook and Queen contiguity. Raster interface dealt with nodatavals (missing/NaN values) while creating the weights object that's why we are seeing those empty pixels.
Coming back to the report, the development timeline for building the project was divided into 3 phases:
- API design phase
- Integration phase
- Optimization phase
Quick Overview
Main goals achieved:
- Studied data structures provided by
xarrayand PySAL'sWandWSPobjects. - Created an initial skeletal implementation of the interface.
- Iteratively designed and experimented with different APIs structures.
- Created a working prototype of the Base Raster Interface.
Pull Requests, Commits and Issues created:
- Issue: [open] Idea collection/discussion for Raster awareness project
- Commit: final API with working prototype
Blog posts published:
Contents:
- I/O dependency for accessing raster
- Planning main functionality for the interface
- Designing interface's API (weights builder)
- Designing interface's API (return journey to
xarray.DataArray) - Iterative approach for API design
Detailed Summary
-
The original plan involved using
rasterioas the main library for raster data access but from the start of the community bonding period, my mentors suggested a shift fromrasteriotoxarray. After going through the documentation ofxarrayit felt superior in terms of usability and accessibility as the features it provided outweighed that ofrasterioand it also featuredrasteriobackend to access the raster data formats easily. Moreover, building the interface to work with the data structure provided by thexarraylibrary made the project available to a broader audience. Therefore I continued with thexarrayorxarray.DataArrayto be specific, as users can easily obtainxarray.DataArrayobject from raster data format usingxarray's I/O functionality which can read from a variety of data formats some of them are listed below:- GDAL Raster Formats via
open_rasteriomethod. - NetCDF via
open_datasetmethod.
- GDAL Raster Formats via
-
After understanding the structure of
xarray.DataArray, it was time to create an initial skeletal implementation of the interface which provided details of the functionality that the interface will offer. As described by Dani in this thread:- The interface would provide the functionality to create both weights object
libpysal.weights.W&WSPfrom user-provided data thoughxarray.DataArrayobject. - It should also support the return journey of the data obtained after an analytical operation on the weights object to
xarray.DataArray.
- The interface would provide the functionality to create both weights object
-
Once the main functionality was finalized, we jumped on to the API designing part of the project. My mentors explained how PySAL was inclined towards an object-oriented paradigm and the majority of the operations are achieved through creating an instance of a particular object using the class method and then calling the instance method. But it was also in the transitioning phase of incorporating functional programming though it was not on the top of their priority list. This motivated us to provide the functionality of direct function calling to convert
DataArrayand create respective weights object, but also implement these methods as a class method using contiguity classes (RookandQueen).from libpysal.weights import raster, Rook import xarray as xr # Accessing raster data using xarray da = xr.open_rasterio("raster.tif") # Method 1 wsp1 = raster.da2WSP(da, criterion="rook") data1 = da.to_series()[wsp1.index] # Method 2 wsp2 = Rook.from_xarray(da, sparse=True) data2 = da.to_series()[wsp2.index] data1.equals(data2)
True -
In the above example,
.from_xarraymethod uses direct methods likeda2Worda2WSPunder the hood to build weights object fromxarray.DataArray. A new module calledrasterwas introduced to hold all the functionalities offered by the interface, it also helped in structuring the interface by separating it with other areas of the library. Just like what we saw with.from_xarraymethod, all the work related to the raster conversion is dispatched to one of the methods in therastermodule.A similar approach was taken for designing the API for the return journey. We implemented 2 types of methods:
toDataArraywhich can be called directly.- Another way was to call the instance method
.to_xarraywhich provided similar functionality to the direct methods.
In the later phase,
.to_xarraymethod was removed due to several limitations because the structure of created weights object was different from the normal ones (more on this later), and therefore these methods would fail if the user passed the weights object not created using the interface. -
It took quite a few iterations to finalize the correct API of the base interface. Below are the early pull requests that I pushed to get feedbacks for the API of the transformational functions. These are far from clean as I was still experimenting with different design decisions.
- PR: [Closed] Raster Interface v1
- PR: [Closed] Raster Interface v2
- PR: [Closed] Raster Interface v3
Commit 9eb8311 was the point of the 1st phase where the majority of the APIs were locked. There were still some areas left where the community was divided particularly in structuring and naming the parameters of the methods, but these were minor issues that were solved in the later stages.
Quick Overview
Main goals achieved:
- Restructured interface by aligning the methods with future weights object design.
- Made
toDataArraymethod work independent of raster metadata. - Added
KNNweights support to the interface. - Fixed documentation, by following the NumPy-Doc convention for docstrings.
- Added unit-tests and an example notebook.
- Explored different ways to optimize the interface.
Pull Requests, Commits and Issues created:
- PR: [merged] Base raster interface
- Issue: [open] Idea collection/discussion for Raster awareness project
Blog posts published:
Contents:
- Refactoring weights object
- Refactoring
toDataArraymethod - Adding distance-based weights object support
- Finalzing base raster interface
- Identifying areas to optimize
Detailed Summary
-
In the second phase, we focused on how to integrate the interface with the libpysal. One major issue related to the integration was that the output weights of the transformation methods (
da2W/da2WSP) were different from the normal weights object, this was due to the extra attributes added to the weights object namelyattrsandcoords. This addition was implemented in the builder method to make the weights object more interactable withxarray.DataArrayas the user will want to access the raster data easily after building the weights from the DataArray. Thereforecoordsattribute stored the coordinates indices of non-missing values in the form ofpandas.MultiIndex, andattrsstored the metadata which was required when going back to thexarray.DataArray. This issue was addressed in the community meeting. After a detailed meeting with community members regarding the weights object, one of the major change that was proposed was to shift towardsWSPobject (here are the meeting notes). Additionally, theid_orderattribute will be replaced byindexwhich will contain an instance ofpandas.Indexaligned with theidsof the weight object.This required a few changes in my existing implementation:
- Renamed
coordstoindexand removedattrsattribute. - Added
indexparameter in the__init__method ofWSPclass. - Fixed creation of
Wfromxarray.DataArraywhich now only relies onda2WSPmethod.
- Renamed
-
A few of the major changes added during the second phase involved the
toDataArraymethod. To make the interface more accessible we decided to only build theDataArrayfrom weights object and data values aligned to the weights object. This was tricky as the weights object does not contain any information related to the missing values except the coordinates in theindexattribute. After several tries of my own, I shifted towards the source code of thepandas.MultiIndex. From my earlier impressions, the data structure ofpandas.MultiIndexwas very different. Once I understood the architecture ofpandas.MultiIndexI pushed a patch with the required changes, this patch refactored the logic and used thecodesandlevelsproperty to construct all the coordinates of theDataArray. Commit e5cd4e6 reflects the changes made targeting this method. LatertoDataArraywas split into 2 separate functionsw2daandwsp2da. We can see the use of this functionality below:from libpysal.weights import raster, Queen # Creating test DataArray da = raster.testDataArray( shape=(10, 56, 49), time=False, rand=False, missing_vals=True ) wsp = Queen.from_xarray( da=da, z_value=5, coords_label=None, sparse=True ) # Accessing data from da using index attribute data = da.to_series()[wsp.index] # Converting back to the DataArray da_back = wsp2da(data, wsp) da_back
<xarray.DataArray (band: 1, y: 56, x: 49)> -1 211 -1 -1 -1 41 37 -1 62 -1 ... -1 171 118 135 28 151 -1 -1 -1 146 Coordinates: * band (band) int64 5 * y (y) float64 66.1 66.2 66.3 66.4 66.5 ... 71.2 71.3 71.4 71.5 71.6 * x (x) float64 92.1 92.2 92.3 92.4 92.5 ... 96.5 96.6 96.7 96.8 96.9 Attributes: nodatavals: (-1,) -
RookandQueencontiguities were not sufficient when considered for further analysis on a raster data becauseRookcontiguity provided max 4 neighbors andQueenprovided max 8. To tackle this, the next step was to implement distance weight builder eitherKNNorDistanceBand. We started withKNN, the initial implementation ofKNNwas very straight forward, we first converted cell centroids into points and then shipped them directly into theKNNbuilder which is based onKDTree. There were 2 major issues with this implementation first was very obvious as raster provided a regular lattice-like structure,KNNcould have been more optimized since there was no need for buildingKDTree. Though the major issue was related to the ordering of the selected neighbors. Since in raster more than 2 neighbors can be equidistant from the focal point, the method inconsistently selected neighbors in a different environment. Therefore this was later removed from the project. -
Once all the components of the base raster Interface were finalized, we started working on the documentation and tests. From the beginning I followed the style of other methods inside libpysal when creating docstrings, luckily my mentors notified me early on to follow NumPy-Doc convention for docstrings. After fixing docstring we worked on adding unit-tests since we were not storing any raster dataset inside the project therefore we decided to create a
testDataArraymethod (usage provided in the above example) which provided us with the different dataset to test interface correctly.I also added an example notebook that introduced the API of the interface and gave a brief overview of its use-case in different scenarios. The notebook can be accessed from here:
Commits 6565dd0 to 94ec4f4 contains the majority of work finalized in the second phase. Since the main API of the base interface was finalized, I created a pull request targeting the master branch of libpysal:
- PR: [merged] Base raster interface
Note: All my main work for the first and second phase lives inside this pull request. The commit history doesn't look clean as for some reason I forced pushed a few changes.
-
Along with working on the interface we were also identifying and exploring the different optimization methods to optimize the interface. This thread documents list of ideas we went through during exploration.
Quick Overview
Main goals achieved:
- Shifted away from
lat2SW-based weight builder. - Redesigned sparse matrix builder based on
COO_matrix. - Numba-fied all possible methods using
njitdecorator. - Added multi-threaded implementation for WSP builder using
joblib. - Added
higher_orderfunctionality to the modified weight builder. - Added raster-based weights object support inside
plot_spatial_weightsmethod insplot.
Pull Requests, Commits and Issues created:
- PR: [WIP] Optimized raster-based weights builder
- PR: [WIP] Added raster weights plotting functionality
- Issue: [open] Distance Band functionality for Raster Interface weights
- Issue: [open] plotting for
libpysalraster functionality
Blog posts published:
Contents:
- Moving on from
lat2SW-based sparse weight builder - Optimizing the addition of higher-order neighbors
- Adding visualization support for the interface
Detailed Summary
-
Following the idea-collection issue, the first target for optimizing the interface was the weight builders. The existing approach used the
lat2SWmethod which provided the main functionality for constructing a sparse matrix for the regular lattice. The main issue while usinglat2SWwas when we’re dealing with data consisting of missing values, in this case, boolean indexing was used for removing missing rows and columns from the created sparse matrix. The performance takes a hit due to boolean indexing ofcsr_matrixand this raised concerns for building weight objects for larger data. Memory consumption inlat2SWis also high due to the use oflistsinstead ofnp.array.A proper explanation of this issue and how it was solved is given in this blog post.
Also, check out this notebook for a performance overview. These enhancements provided huge benefits both in terms of memory efficiency and faster performance. This also made the interface usable with large datasets.
-
In the previous section, I explained how
KNN-based weight object was not very consistent when dealing with the raster-based data. Therefore, we decided to implementhigher_orderfunctionality, and 2 approaches were taken when adding the higher-order neighbors:-
Implementing the first approach was relatively easier than the second approach, as only a few changes were added inside the modified weights builder. An extra argument was provided which acted as a
thresholdand then using modular arithmetic conditions the algorithms added the neighbors lying inside thethresholdradius also following contiguity criterion, though this implementation was different as it added higher order neighbors even if the lower order neighbors were missing and therefore it was more likeDistanceBand. This thread provides some insightful discussion related to howDistanceBandbehaves with raster data: -
As for the second approach, we were able to implement a correct algorithm for
higher_orderfunctionality inside weight builder, this algorithm used recursion to traverse nth-order neighbors or nodes because raster can be assumed as a graph. Unfortunately, we could not incorporatenumbaandmulti-threadingto the method and therefore the algorithm was very inefficient. But after some testing, we were able to add a proper algorithm for using the method that Martin suggested in this thread.- Issue: higher_order weights of <= k
Since both approaches are different from each other we added
include_nasargument which ifTrue, computes weights using the first approach, and ifFalsethe builder uses the second approach. We can take a look at the visual example below which explains this more intuitively.Here we used
testDataArraymethod to create a small raster data filled with random and missing values.Fig. 6shows theRookcontiguity withk=1which means all first-order rook neighbors are selected.Fig. 7shows theRookcontiguity withk=2but withinclude_nas=Falsewhich means allnon-missingfirst and second-order rook neighbors are selected (this uses the second approach as described previously).include_nasisTrueforFig. 8, we can see that in this figure all the first order neighbors are selected but while selecting second order neighbors, the method takes consideration of (missing + nonmissing) first-order neighbors.
 After completion of these methods, a pull request was created targeting the master branch of
 libpysalwhich added optimized weights builder andhigher_orderfunctionality. This pull request describes how these approaches are different from each other: -
This marked the end of the optimization phase.
-
Along with optimization work, we also worked on adding the support for plotting functionality for a raster-based weight object. This required some changes inside the
plot_spatial_weightsmethod, mainly making it work with sparse weight objects instead of dense weight objects and adding adaargument for passingDataArrayobject.- Issue: [open] plotting for
libpysalraster functionality - PR: [WIP] Added raster weights plotting functionality
The visualization aspect of the project is still in progress, once this pull request gets reviewed. I'll add more enhancements which are listed in the issue.
- Issue: [open] plotting for
- Since the weight object is being refactored to remove the legacy part and adopt new features from newly available libraries like
pandasandxarray. I'll need to reflect these changes to the interface once they are incorporated into thelibpysal. - Additionally, the interface once merged will be in the alpha-testing phase and I'm expecting new bugs to pop-in which we were not able to test. Therefore I'll have to be available to provide the bug fixes for a few initial months of merging the interface.
- However optimized the weights builder can be, there will be still a chance that the program will run out of memory as the raster size increases. One ambitious idea when working on the interface was related to lazily building the weights object. I did some early explorational prototyping for this part ([WIP] : Lazy weights object for raster interface) but it'll require a massive change in the structure of the weights object probably a new class only supporting lazy operations. Once it is successfully implemented all the conversion and computation will be lazy which will allow users to use larger than memory rasters, albeit the computations will be slow.
- Even though
xarrayprovides great support forDask, the project has not yet taken advantage of or supportdaskstructures. It'll be a nice functionality to add to the interface in the future.
As a computer science undergrad this project was a breath of fresh air for me since I was relatively new to the PySAL library and the field of geospatial data science. I gained lots of experience working on this project especially working on somethings I wasn't completely familiar with.
I like to thank my mentors Stefanie, Dani, Levi for taking the time to review the prs, clearing my doubts, and providing me with valuable feedback which helped me along the way of building this project. I also appreciate the work of other community members working on this cool library.
Now I'll meet you in the new season of surviving 2020 (post-gsoc edition).
Mragank Shekhar