Navigation Menu

Skip to content

Instantly share code, notes, and snippets.

@allisonmorgan
Last active July 18, 2018 14:37
Show Gist options
  • Star 0 You must be signed in to star a gist
  • Fork 0 You must be signed in to fork a gist
  • Save allisonmorgan/70122462f884786ba7fdfcd31423a17b to your computer and use it in GitHub Desktop.
Save allisonmorgan/70122462f884786ba7fdfcd31423a17b to your computer and use it in GitHub Desktop.
Salsa Analysis

Steps to evaluating salsa success:

  1. Used an API to get information on 500 recipes which contain the query string “salsa” and have been classified as a “condiment or sauce”.

  2. Tried to clean and stem the ingredients from these recipes the best I could (see util.py). Note in some cases the ingredient was listed ambiguously: onion, versus red, white or green onion. I did not standardize on those.

The process resulted in a feature matrix of each recipe (500 rows by 228 ingredients). Each row is filled with zeros or ones indicating the presence of an ingredient. (Information about amounts was much trickier to obtain and standardize.)

  1. Ran an ordered logistic regression model for predicting these recipes ratings (scale of 1 to 5), where my covariates were the first 60 most common ingredients (these ingredients described 90% of all recipes). The significant variables (p < 0.05) were:
Coefficient Pr(>|z|)
garlic 0.773311 0.006434 **
tomatillo -1.199859 0.003269 **
white.sugar 0.916964 0.028308 *
avocado 1.170948 0.008611 **
chili 2.570479 0.000810 ***
mint 2.136439 0.028465 *
cranberry 1.948929 0.038755 *

Significant codes: 0 ‘***’ 0.001 ‘**’ 0.01 ‘*’ 0.05

My R^2 value was really low (0.2), so the above should be taken with a large grain of salt 😉. The predicted rating of my salsa, which was tomatillo based, was 3.62, and the real life rating was 4.23. Regression code shown here (see regression.R).

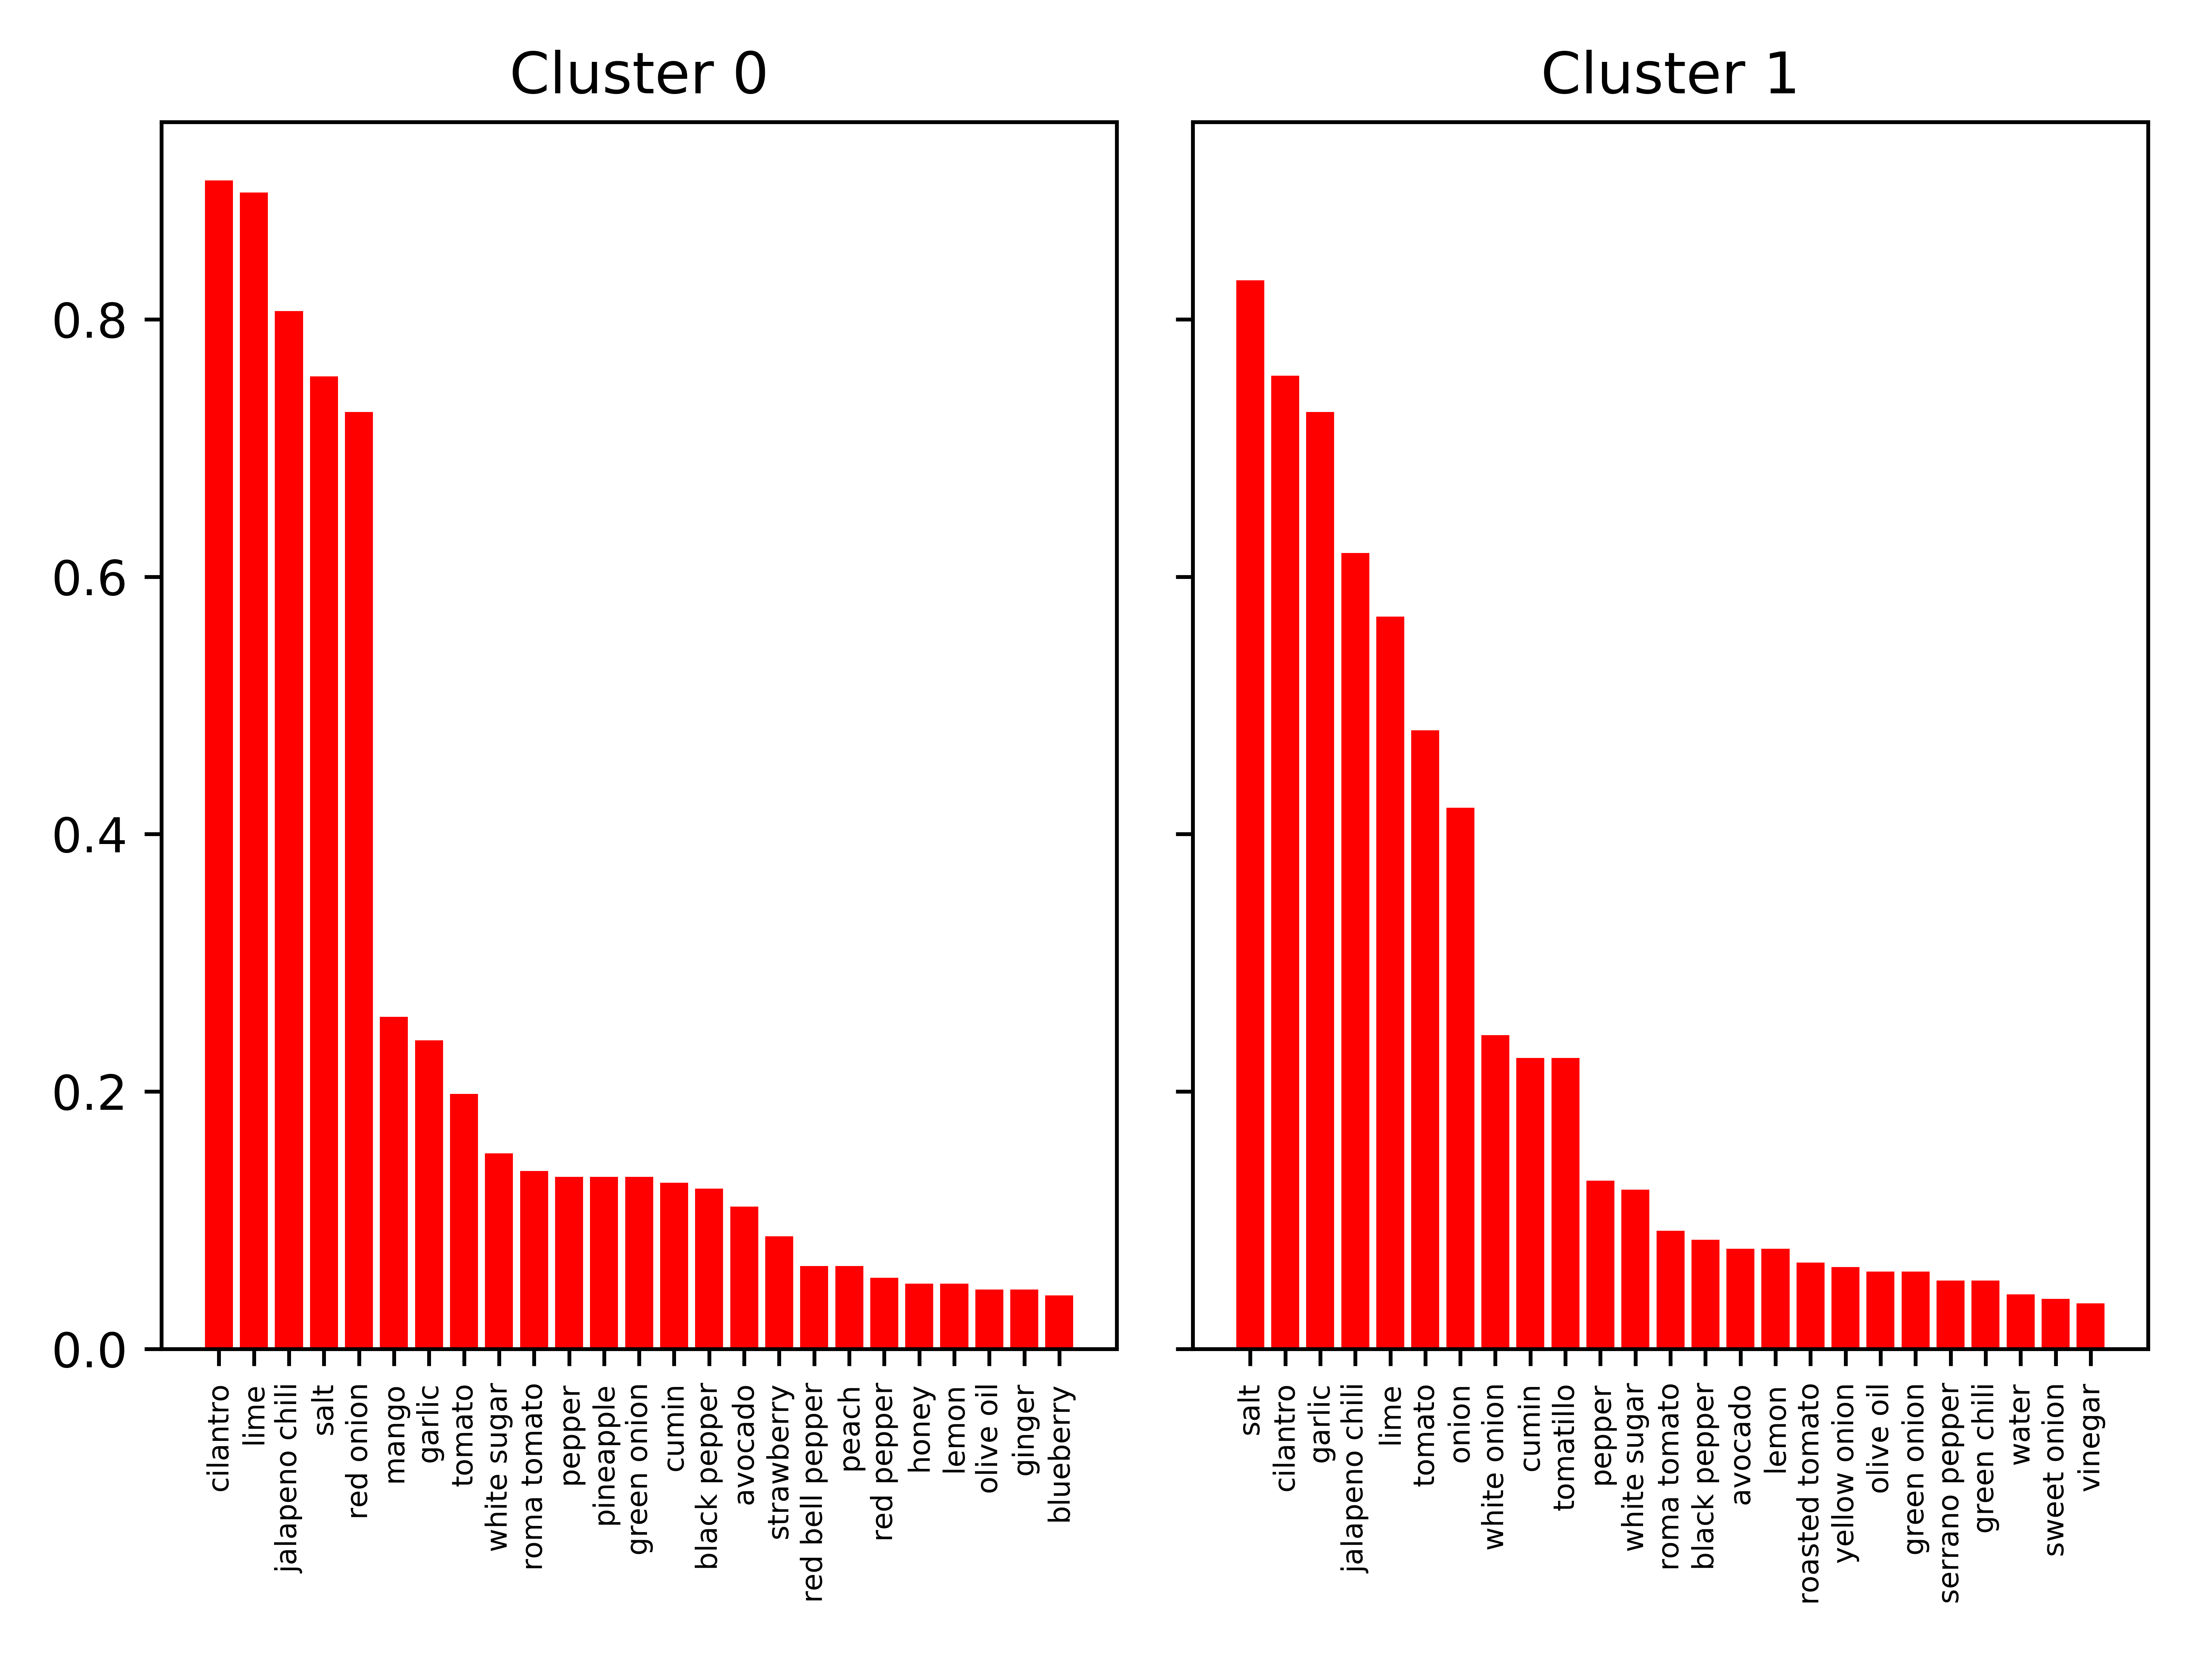
Also, I used a Gaussian mixture model for clustering the salsas into sweet and savory categories.

histogram_25_clusters

library(rms)
library(jsonlite)
library(lmtest)
##
## Read in the feature matix
##
feature_matrix <- read.csv(file='feature_matrix.csv', row.names = 1, header=TRUE, sep=',')
feature_matrix$matches.id <- rownames(feature_matrix)
parse.json <- function(filename)
{
fl <- flatten(data.frame(fromJSON(filename)['matches']))
return(fl[, c("matches.id", "matches.rating")])
}
# Merge recipes with their ratings
json.dir <- 'salsa_search/'
results <- lapply(list.files(json.dir, full.names = TRUE, pattern = "\\.json$"), parse.json)
final.table <- do.call("rbind", results)
merged <- merge(x=feature_matrix, y=final.table, by.x = "matches.id", by.y = "matches.id")
##
## Fit ordered logistic regression on rating variable
##
merged$rating <- factor(merged$matches.rating)
# Note: in `summary.py`, it was found that 90% of recipes are made
# up of 60 unique ingredients. Let's only consider those first 60.
# Another statistical package for running ordinal logistic regression
m <- lrm(rating ~ cilantro + salt + lime + jalapeno.chili + garlic + tomato + red.onion + onion + cumin + white.onion + tomatillo + white.sugar + pepper + mango + roma.tomato + black.pepper + avocado + green.onion + lemon + pineapple + olive.oil + roasted.tomato + green.chili + red.bell.pepper + yellow.onion + peach + serrano.pepper + strawberry + honey + red.pepper + cucumber + sweet.onion + water + bell.pepper + cherry.tomato + garlic.powder + green.bell.pepper + vinegar + chili + ginger + chili.powder + parsley + blueberry + apple.cider.vinegar + cayenne.pepper + ground.pepper + chipotle.pepper + shallots + serrano.chile + red.pepper.flake + green.pepper + garlic.salt + red.wine.vinegar + corn + extra.virgin.olive.oil + mint + cranberry + white.vinegar, data = merged)
print(m)
coeftest(m)
# Predict the value of my salsa!
x <- read.csv(file='predict.csv', row.names = 1, header=TRUE, sep=',')
y <- predict(m, newdata=x, type="mean")
print(y)
# from sklearn.cluster import KMeans
from sklearn.mixture import GaussianMixture
from collections import Counter
from util import get_ingredients
import matplotlib.pyplot as plt
import pandas as pd
import numpy as np
##
## Generate histogram of all salsa recipes
##
ingredients, ids = get_ingredients()
ingredients = ingredients[:500]; ids = ids[:500] # Select just the first 500
histogram = Counter()
for line in ingredients:
for each in line:
histogram[each] += 1
counts = sorted(histogram.items(), key=lambda x: x[1], reverse=True)
labels = [i for i, j in counts]
print "Number of unique ingredients: {0}, Number of recipes: {1}.\nTop ingredients: {2}".format(len(histogram), len(ingredients), counts[:20])
plt.figure(figsize=(12, 4)); limit = 100; top = [j for i, j in counts[:limit]]
plt.bar(range(limit), [j/float(len(ingredients)) for i, j in counts[:limit]], color='red')
plt.xticks(range(limit), labels[:limit], rotation=90, fontsize=6)
plt.tight_layout()
plt.savefig('histogram_{0}.png'.format(limit), dpi = 1000)
##
## Run GMM clustering
##
mat = []
for i, line in enumerate(ingredients):
row = np.zeros(len(histogram))
for each in line:
row[labels.index(each)] = 1.0
mat.append(row)
df = pd.DataFrame(mat, columns = labels, index = ids)
# Find the best number of clusters
n_components = np.arange(1, 11)
models = [GaussianMixture(n, random_state = 0).fit(df) for n in n_components]
# Shows the best number of clusters is _2_
plt.clf()
plt.figure(figsize=(12, 4));
plt.plot(n_components, [m.bic(df) for m in models], label='BIC')
plt.plot(n_components, [m.aic(df) for m in models], label='AIC')
plt.legend()
plt.xlabel('n_components')
plt.savefig('aic_bic.png', dpi = 1000)
# Save this matrix and the ingredient list
df.to_csv('feature_matrix.csv', encoding = 'utf-8')
with open('ingredient_list.txt', 'w') as file:
for label in labels:
file.write(label + "\n")
# How many covariates should I consider? Let's choose the number of ingredients
# which explain > 90% of all recipes.
x = []; y = []; denom = float(df.values.sum()); running_total = 0
for i, (name, col) in enumerate(df.iteritems()):
x.append(i)
running_total += col.values.sum()
y.append(running_total/denom)
plt.clf()
plt.figure(figsize=(12, 4));
plt.plot(x, y)
plt.xlabel('Unique Ingredients')
plt.ylabel('Total Number of Ingredients')
plt.savefig('total_ingredients.png', dpi = 1000)
for i, val in enumerate(y):
if val >= 0.90:
print "Total number of ingredients explain 90% of all recipes: {0}".format(x[i])
break
n_clusters = 2; limit = 25;
gmm = GaussianMixture(n_clusters, random_state = 0).fit(df)
assert gmm.converged_
gmm_labels = gmm.predict(df)
_, dist = np.unique(gmm_labels, return_counts=True)
print "Size of each cluster: {0}".format(dist)
f, axarray = plt.subplots(1, n_clusters, sharey=True)
for i in range(n_clusters):
ingredients = dict.fromkeys(labels, 0.0); contains = set()
# print ">>> Cluster {0}".format(i)
for j, cluster in enumerate(gmm_labels):
if i == cluster:
recipe = mat[j]
for k, l in enumerate(recipe):
if l == 1:
contains.add(labels[k])
ingredients[labels[k]] += 1
counts = sorted(ingredients.items(), key=lambda x: x[1], reverse=True)[:limit]
top = [n for m, n in counts]
axarray[i].bar(range(len(counts)), [n/float(dist[i]) for m, n in counts], color='red')
axarray[i].set_title("Cluster {0}".format(i))
plt.sca(axarray[i])
plt.xticks(range(len(counts)), [m for m, n in counts], rotation=90, fontsize=6)
# print "Contains: {0}".format(contains)
# print "\n"
plt.tight_layout()
plt.savefig('histogram_{0}_clusters.png'.format(limit), figsize=(20, 4), dpi = 1000)
# -*- coding: utf-8 -*-
import json
import os
import re
# Remove all superlatives
superlatives = r"[ ]*[finely ]*chopped[ ]*|[ ]*fresh[ ]+|[ ]*freshly[ ]+|[ ]*peeled[ ]+|[ ]*crushed[ ]+|[ ]*[petite ]*diced[ ]+|[ ]*minced[ ]+|[ ]*shredded[ ]*|[ ]*leaves$|[ ]*coarsely[ ]+|[ ]*coarse[ ]+|^fine[ ]+|[ ]*large[ ]+|[ ]*small[ ]+|[ ]*medium[ ]+|[ ]+minicube[s]*$|^knorr[®]*[ ]+|^(hellmann's\xae or best foods\xae)[ ]+|^[ ]*bottled[ ]+|^[ ]*canned[ ]+|^(no-salt-added)[ ]+|^fire[ ]*|^(vine ripened)[ ]*|^rotel[ ]+|^rotelle$|^organic[ ]+|^chunky$|^pickling[ ]+|^canning[ ]+|[ ]*kosher[ ]+|[ ]*sea[ ]+|[ ]*light[ ]+|^juice$|[ ]+(in juice)$|[ ]+slices$|^[corn ]*(tortilla chips)$|^boiling[ ]+|^cracked[ ]+|^frozen[ ]+|[ ]+kernels$|[ ]+cloves$|^seasoning$|[ ]+crumbles$|[ ]+sprigs$|^mini[ ]+|^seeds$|^(goya fancy)[ ]+|^sauce$|^herbs$"
# Standardize ingredients
def ingredient_equals(string):
if string.count('ground salt'):
return 'salt'
elif any([string.count(lime) for lime in ['lime juice', 'key lime', 'key lime juice']]):
return 'lime'
elif string.count('lemon juice'):
return 'lemon'
elif string.count('sweet corn'):
return 'corn'
elif any([string.count(cherry) for cherry in ['pitted cherries', 'sweet cherries']]):
return 'cherries'
elif any([string.count(tomato) for tomato in ['cherry tomatoes', 'grape tomatoes']]):
return 'cherry tomatoes'
elif any([string.count(tomato) for tomato in ['roma tomatoes', 'plum tomatoes']]):
return 'roma tomatoes'
elif string == 'clove':
return 'garlic'
elif any([string.count(sugar) for sugar in ['granulated sugar', 'white sugar', 'sugar']]):
return 'white sugar'
elif any([string == salsa for salsa in ['salsa', 'salsa verde', 'tomato salsa']]):
return ''
elif string.count('ground black pepper'):
return 'black pepper'
elif string.count('ground cumin'):
return 'cumin'
elif any([string == grape for grape in ['seedless red grapes', 'seedless green grapes']]):
return 'grapes'
elif string == 'granny smith apples':
return 'green apples'
elif string == 'scallions':
return 'green onion'
return string
# Stem plurals
def stem(string):
string = re.sub(r'peppers$', 'pepper', string)
string = re.sub(r'chilies$', 'chili', string)
string = re.sub(r'chiles$', 'chile', string)
string = re.sub(r'onions$', 'onion', string)
string = re.sub(r'tomatoes$', 'tomato', string)
string = re.sub(r'apples$', 'apple', string)
string = re.sub(r'cucumbers$', 'cucumber', string)
string = re.sub(r'tomatillos$', 'tomatillo', string)
string = re.sub(r'seeds$', 'seed', string)
string = re.sub(r'berries$', 'berry', string)
string = re.sub(r'peaches$', 'peach', string)
string = re.sub(r'shallots$', 'shallots', string)
string = re.sub(r'flakes$', 'flake', string)
string = re.sub(r'persimmons$', 'persimmon', string)
string = re.sub(r'cherries$', 'cherry', string)
string = re.sub(r'grapes$', 'grape', string)
string = re.sub(r'plums$', 'plum', string)
string = re.sub(r'apricots$', 'apricot', string)
string = re.sub(r'sprouts$', 'sprout', string)
string = re.sub(r'beans$', 'bean', string)
string = re.sub(r'jalepenos$', 'jalepeno', string)
string = re.sub(r'nuts$', 'nut', string)
string = re.sub(r'pears$', 'pear', string)
string = re.sub(r'nectarines$', 'nectarine', string)
string = re.sub(r'greens$', 'greens', string)
string = re.sub(r'papadews$', 'papadew', string)
string = re.sub(r'pimientos$', 'pimiento', string)
string = re.sub(r'segments$', 'segment', string)
string = re.sub(r'shoots$', 'shoot', string)
string = re.sub(r'raisins$', 'raisin', string)
return string
def get_ingredients():
ingredients = []; ids = []
for file in os.listdir('salsa_search'):
with open('salsa_search/' + file) as f:
x = json.load(f)
recipes = x['matches']
for recipe in recipes:
if recipe["rating"] <= 0: continue # Salsa must have a rating > 0
x = []; # Sometimes ingredients contain 'and' or 'with' (e.g. 'salt and pepper')
for each in recipe['ingredients']:
x.extend(re.split(" with | and ", each))
if len(x) > 0 and recipe['id'] not in ids:
y = []
for each in x:
each = each.lower()
# More ad-hoc rules
each = ingredient_equals(each)
# Remove 'chopped', 'fresh', etc.
z = re.sub(superlatives, ' ', each).strip()
# There aren't that many plurals in my data set, so let's just code them by hand
z = stem(z)
if len(z) > 0:
y.append(z)
ingredients.append(y)
ids.append(recipe['id'])
return ingredients, ids
Sign up for free to join this conversation on GitHub. Already have an account? Sign in to comment