-
-
Save analyticascent/556ddbc3c74043676545b6ea43fa907d to your computer and use it in GitHub Desktop.
| { | |
| "cells": [ | |
| { | |
| "cell_type": "markdown", | |
| "metadata": { | |
| "colab_type": "text", | |
| "id": "view-in-github" | |
| }, | |
| "source": [ | |
| "<a href=\"https://colab.research.google.com/gist/analyticascent/556ddbc3c74043676545b6ea43fa907d/text_classification_demo.ipynb\" target=\"_parent\"><img src=\"https://colab.research.google.com/assets/colab-badge.svg\" alt=\"Open In Colab\"/></a>" | |
| ] | |
| }, | |
| { | |
| "cell_type": "markdown", | |
| "metadata": { | |
| "colab_type": "text", | |
| "id": "XaQ4mceVzuUc" | |
| }, | |
| "source": [ | |
| "# Binary Text Classification - With Just 20 Lines of Python :-D\n", | |
| "---\n", | |
| "### No prior coding experience needed (some Python knowledge still helps). In under an hour or so, you should be able to read through this notebook and understand the purpose of each line of code.\n", | |
| "\n", | |
| "This notebook was made with the purpose of showing the **least amount of code** someone would need to know in order to understand how software can be used to **sort text into one category or another** (text classification). It uses similar techniques that a spam filter would use, but instead of sorting email messages into *spam* or *not spam*, we will sort Twitter posts (Tweets) by *which of two users* likely made them.\n", | |
| "\n", | |
| "There are two types of \"cells\" in this notebook file: *markdown text* (like what your reading now - click this text and you'll see the cell highlighted) and *python code* cells (I'll let you know when we get to our first instance of that cell type).\n", | |
| "\n", | |
| "## For each line of code, you want to learn the following:\n", | |
| "\n", | |
| "* What information does the line of code take in as **input** data\n", | |
| "* What does the line of code produce as **output** data (or *store* in a **variable**)\n", | |
| "* Why that line of code was **needed** for text classification to work" | |
| ] | |
| }, | |
| { | |
| "cell_type": "markdown", | |
| "metadata": {}, | |
| "source": [ | |
| "**You don't need to install anything to read through the text and code in this file to learn how it works. But if you actually want to run this file yourself, you have two options:** Run it with *Colab* using the top link icon (if you have a Gmail account), or run it *locally* on your device if you have Anaconda Python 3 installed.\n", | |
| "\n", | |
| "**But before you even consider either of those, you may as well study the notebook in it's executed state (which is what you see when you first get to this via any link on Github).** Here's a quick summary of what you need to know to make sense of what the code below does:\n", | |
| "\n", | |
| "* **What this file is:** This is a **Jupyter Notebook.** This type of file contains *markdown documentation cells* (like the text your reading right now) and *code cells* (which contain the actual Python code for the program itself). In this case, the Python code in this notebook is the *bare minimum* amount of Python needed to perform and understand the fundamentals of text classification. \n", | |
| "\n", | |
| "* **What it will do:** The code in this notebook will be used to sort Twitter posts (\"Tweets\") according to which of two users wrote them. I left out various accuracy boosting techniques from this file for the sake of simplicity.\n", | |
| "\n", | |
| "* **How it works:** Computers can't consciously \"read\" text, but they can certainly crunch numbers. The code below takes in a spreadsheet file I uploaded to Github. It contains Tweets from two Twitter users that discuss the same subject matter (economics), but they each have a somewhat different \"style\" of discussing the same subject. The code will *quantify* (\"vectorize\" is the technical term...) how often each user tends to use various words, and then uses an algorithm to distinguish one user from the other based on these patterns. **The least you need to know is that the program counts *how often different words* are used by each user, and uses that result to infer who posted Tweets that have usernames stripped away.**\n", | |
| "\n", | |
| "### The Five Sections of this Notebook:\n", | |
| "\n", | |
| "* **First:** Importing the Python libraries needed for text classification\n", | |
| "* **Second:** Loading in the file containing the Tweets as a Pandas dataframe\n", | |
| "* **Third:** Defining the variables the classifier will use to predict usernames\n", | |
| "* **Fourth:** Converting Tweet content into a format the algorithm can work with\n", | |
| "* **Fifth:** Training the algorithm to sort Tweets by username, and test it's accuracy\n", | |
| "\n", | |
| "Now you'll examine what each line of code does. **Your goal is to learn the purpose of each line of code - you don't have to memorize each line by heart but you will need to understand why the code is there in the first place.**" | |
| ] | |
| }, | |
| { | |
| "cell_type": "markdown", | |
| "metadata": {}, | |
| "source": [ | |
| "---\n", | |
| "## 1. Importing the Necessary Python Libraries (the tools for classification)\n", | |
| "\n", | |
| "**In this first section:**\n", | |
| "\n", | |
| "* We will import the tools (which are called \"libraries\" in programming) needed for text classification\n", | |
| "\n", | |
| "The code cells below in this section import all the necessary python libraries to use *machine learning* for text classification. **In a simple sense of the term, you can think of *machine learning* as a software approach where a program gets *trained* by data.**\n", | |
| "\n", | |
| "*Any text in a code cell that comes after a \"**#**\" symbol is just a raw comment describing what the code does.* **Our first code cell is below:**" | |
| ] | |
| }, | |
| { | |
| "cell_type": "code", | |
| "execution_count": 1, | |
| "metadata": { | |
| "colab": {}, | |
| "colab_type": "code", | |
| "collapsed": true, | |
| "id": "cxfmyozVzfXd" | |
| }, | |
| "outputs": [], | |
| "source": [ | |
| "# These libraries are used for working with rows and columns of data (like the CSV file of Tweets)\n", | |
| "\n", | |
| "import pandas as pd # using \"as pd\" allows us to call pandas with 'pd' instead of typing it's whole name" | |
| ] | |
| }, | |
| { | |
| "cell_type": "markdown", | |
| "metadata": {}, | |
| "source": [ | |
| "### What the library we just imported does:\n", | |
| "\n", | |
| "* **pandas** allows you to work with *dataframes* (rows and columns of data) and read in various files\n", | |
| "\n", | |
| "With this library, we can load in an online file with the Tweet data we'll work with. The file loaded in consists of rows and columns (think of an Excel spreadsheet) and a *pandas dataframe* generated by these does as well." | |
| ] | |
| }, | |
| { | |
| "cell_type": "code", | |
| "execution_count": 2, | |
| "metadata": { | |
| "collapsed": true | |
| }, | |
| "outputs": [], | |
| "source": [ | |
| "# Here are more specific tools for converting tweet text into a format an algorithm can work with\n", | |
| "\n", | |
| "from sklearn.feature_extraction.text import CountVectorizer # counts how often different words appear\n", | |
| "from sklearn.model_selection import train_test_split # splits word count data into training/testing sets" | |
| ] | |
| }, | |
| { | |
| "cell_type": "markdown", | |
| "metadata": {}, | |
| "source": [ | |
| "### What the libraries we just imported do:\n", | |
| "\n", | |
| "* **CountVectorizer** converts raw text into *document-term matrices* - which store counts of how often different words appear\n", | |
| "\n", | |
| "* **train_test_split** is used to divide data into a set used to *train* a classifier algorithm and another used to *test* it's accuracy" | |
| ] | |
| }, | |
| { | |
| "cell_type": "code", | |
| "execution_count": 3, | |
| "metadata": { | |
| "collapsed": true | |
| }, | |
| "outputs": [], | |
| "source": [ | |
| "# The code below imports the algorithm we'll use and a tool for measuring it's accuracy\n", | |
| "\n", | |
| "from sklearn.naive_bayes import MultinomialNB # an algorithm we'll use to classify the Tweets\n", | |
| "from sklearn import metrics # used to measure the accuracy of the model once it's been trained" | |
| ] | |
| }, | |
| { | |
| "cell_type": "markdown", | |
| "metadata": {}, | |
| "source": [ | |
| "### What the libraries we just imported do:\n", | |
| "\n", | |
| "* **MultinomialNB** is the algorithm we'll use to distinguish *who* made *what* Tweets, don't worry about it's specifics\n", | |
| "\n", | |
| "* **metrics** will measure the accuracy of the classifier using the test set of the data from *train_test_split*" | |
| ] | |
| }, | |
| { | |
| "cell_type": "markdown", | |
| "metadata": {}, | |
| "source": [ | |
| "We now have everything it takes to read in the data file (`pandas`), and convert the unstructed data (a raw text column in the CSV file) into something structured: **A [document-term matrix](https://en.wikipedia.org/wiki/Document-term_matrix), which you can think of (for this notebook at least) as a record of how often the two users use various words.** And after that, *split* that result into data used to **train** the classifier algorithm (Multinomial Naive Bayes) to sort Tweets by who wrote them, and data used to **test** how accurate it is. `metrics` will then be used to measure the accuracy of that classifier on that **test** data.\n", | |
| "\n", | |
| "Later you'll see in greater detail what a document-term matrix looks like, for now you only need to know that it contains numbers that show how often the two Twitter users we got the Tweets from use different words.\n", | |
| "\n", | |
| "**It's this difference in *how often* each user uses different words that the algorithm will try to distinguish the two users by.**" | |
| ] | |
| }, | |
| { | |
| "cell_type": "markdown", | |
| "metadata": { | |
| "colab_type": "text", | |
| "id": "2fDwwL614Qxj" | |
| }, | |
| "source": [ | |
| "---\n", | |
| "## 2. Loading in the CSV File Containing the Tweet Collection\n", | |
| "\n", | |
| "**In this second section:** \n", | |
| "\n", | |
| "* We will get the CSV file of tweets from a repository I set up on Github\n", | |
| "* Then load that Tweet collection into the notebook as a pandas dataframe \n", | |
| "\n", | |
| "First, a brief summary of what a CSV file is.\n", | |
| "\n", | |
| "CSV stands for *comma-separated values* - you can think of it as a \"text file\" format for data. It's similar to any other spreadsheet with **rows** and **columns**. The file we are loading in contains a new *row for each Tweet*, and has *three columns*: the *time* a Tweet was posted, the *raw text* of the Tweet, and the *user* who posted it.\n", | |
| "\n", | |
| "**I used a Python Library called Tweepy to download the two Twitter feeds featured in this CSV file. How that's done is beyond the scope of this notebook, but I may cover that process elsewhere.**" | |
| ] | |
| }, | |
| { | |
| "cell_type": "code", | |
| "execution_count": 4, | |
| "metadata": { | |
| "colab": {}, | |
| "colab_type": "code", | |
| "collapsed": true, | |
| "id": "UK4xNSSd0qZQ" | |
| }, | |
| "outputs": [], | |
| "source": [ | |
| "# The link below is to the CSV file I uploaded to Github, it will get stored in the \"url\" variable\n", | |
| "\n", | |
| "url = 'https://raw.githubusercontent.com/analyticascent/stylext/master/csv/tweets.csv' # define url as the CSV data" | |
| ] | |
| }, | |
| { | |
| "cell_type": "markdown", | |
| "metadata": {}, | |
| "source": [ | |
| "### What the code above does:\n", | |
| "\n", | |
| "* It gets the CSV file containing the Tweets from where it's posted online\n", | |
| "* The contents of that file are stored in the `url` variable" | |
| ] | |
| }, | |
| { | |
| "cell_type": "code", | |
| "execution_count": 5, | |
| "metadata": { | |
| "collapsed": true | |
| }, | |
| "outputs": [], | |
| "source": [ | |
| "tweets = pd.read_csv(url) # define \"tweets\" as a pandas (pd) dataframe containing the CSV rows/columns in \"url\"" | |
| ] | |
| }, | |
| { | |
| "cell_type": "markdown", | |
| "metadata": {}, | |
| "source": [ | |
| "### What the code above does:\n", | |
| "\n", | |
| "* Converts the CSV data that's stored in `url` into a pandas dataframe\n", | |
| "* It then stores that dataframe inside of the `tweets` variable" | |
| ] | |
| }, | |
| { | |
| "cell_type": "code", | |
| "execution_count": 6, | |
| "metadata": {}, | |
| "outputs": [ | |
| { | |
| "data": { | |
| "text/html": [ | |
| "<div>\n", | |
| "<style>\n", | |
| " .dataframe thead tr:only-child th {\n", | |
| " text-align: right;\n", | |
| " }\n", | |
| "\n", | |
| " .dataframe thead th {\n", | |
| " text-align: left;\n", | |
| " }\n", | |
| "\n", | |
| " .dataframe tbody tr th {\n", | |
| " vertical-align: top;\n", | |
| " }\n", | |
| "</style>\n", | |
| "<table border=\"1\" class=\"dataframe\">\n", | |
| " <thead>\n", | |
| " <tr style=\"text-align: right;\">\n", | |
| " <th></th>\n", | |
| " <th>time_stamp</th>\n", | |
| " <th>raw_text</th>\n", | |
| " <th>username</th>\n", | |
| " </tr>\n", | |
| " </thead>\n", | |
| " <tbody>\n", | |
| " <tr>\n", | |
| " <th>0</th>\n", | |
| " <td>2016-05-17 04:53:06</td>\n", | |
| " <td>*Tweets about his IQ but misspells both letter...</td>\n", | |
| " <td>DLin71_feed</td>\n", | |
| " </tr>\n", | |
| " <tr>\n", | |
| " <th>1</th>\n", | |
| " <td>2016-05-17 02:20:27</td>\n", | |
| " <td>Fascinating quotes on the back of Trump's new ...</td>\n", | |
| " <td>DLin71_feed</td>\n", | |
| " </tr>\n", | |
| " <tr>\n", | |
| " <th>2</th>\n", | |
| " <td>2016-05-17 02:06:07</td>\n", | |
| " <td>ME: Want to see a magic trick?\\r\\nCHILD: Yes!\\...</td>\n", | |
| " <td>DLin71_feed</td>\n", | |
| " </tr>\n", | |
| " <tr>\n", | |
| " <th>3</th>\n", | |
| " <td>2016-05-16 03:43:53</td>\n", | |
| " <td>@pmarca Experts Insist That Tetherball Has Fin...</td>\n", | |
| " <td>DLin71_feed</td>\n", | |
| " </tr>\n", | |
| " <tr>\n", | |
| " <th>4</th>\n", | |
| " <td>2016-05-16 03:21:34</td>\n", | |
| " <td>2012 NOMINEE: I have a car elevator\\r\\nGOP: *f...</td>\n", | |
| " <td>DLin71_feed</td>\n", | |
| " </tr>\n", | |
| " </tbody>\n", | |
| "</table>\n", | |
| "</div>" | |
| ], | |
| "text/plain": [ | |
| " time_stamp raw_text \\\n", | |
| "0 2016-05-17 04:53:06 *Tweets about his IQ but misspells both letter... \n", | |
| "1 2016-05-17 02:20:27 Fascinating quotes on the back of Trump's new ... \n", | |
| "2 2016-05-17 02:06:07 ME: Want to see a magic trick?\\r\\nCHILD: Yes!\\... \n", | |
| "3 2016-05-16 03:43:53 @pmarca Experts Insist That Tetherball Has Fin... \n", | |
| "4 2016-05-16 03:21:34 2012 NOMINEE: I have a car elevator\\r\\nGOP: *f... \n", | |
| "\n", | |
| " username \n", | |
| "0 DLin71_feed \n", | |
| "1 DLin71_feed \n", | |
| "2 DLin71_feed \n", | |
| "3 DLin71_feed \n", | |
| "4 DLin71_feed " | |
| ] | |
| }, | |
| "execution_count": 6, | |
| "metadata": {}, | |
| "output_type": "execute_result" | |
| } | |
| ], | |
| "source": [ | |
| "tweets.head() # check the first five rows (tweets) of the pandas dataframe" | |
| ] | |
| }, | |
| { | |
| "cell_type": "markdown", | |
| "metadata": { | |
| "colab_type": "text", | |
| "id": "F6u48CG0DcXG" | |
| }, | |
| "source": [ | |
| "### What the code above does:\n", | |
| "\n", | |
| "* Displays the first five rows of the pandas dataframe we just created in the 5th code cell from a CSV file\n", | |
| "\n", | |
| "* The `Out[6]:` is the displayed output from `tweets.head()` showing the first five rows and their columns\n", | |
| "\n", | |
| "Above is the first five rows of the rows and columns of tweets, you can see the first of the two users under our \"Y\" variable (username). Notice that the first five rows come from the first `username` that the Tweets came from.\n", | |
| "\n", | |
| "Below is the last five rows, notice that a different username's tweets are visible there. " | |
| ] | |
| }, | |
| { | |
| "cell_type": "code", | |
| "execution_count": 7, | |
| "metadata": { | |
| "colab": {}, | |
| "colab_type": "code", | |
| "id": "fBpDVn8-2S_r" | |
| }, | |
| "outputs": [ | |
| { | |
| "data": { | |
| "text/html": [ | |
| "<div>\n", | |
| "<style>\n", | |
| " .dataframe thead tr:only-child th {\n", | |
| " text-align: right;\n", | |
| " }\n", | |
| "\n", | |
| " .dataframe thead th {\n", | |
| " text-align: left;\n", | |
| " }\n", | |
| "\n", | |
| " .dataframe tbody tr th {\n", | |
| " vertical-align: top;\n", | |
| " }\n", | |
| "</style>\n", | |
| "<table border=\"1\" class=\"dataframe\">\n", | |
| " <thead>\n", | |
| " <tr style=\"text-align: right;\">\n", | |
| " <th></th>\n", | |
| " <th>time_stamp</th>\n", | |
| " <th>raw_text</th>\n", | |
| " <th>username</th>\n", | |
| " </tr>\n", | |
| " </thead>\n", | |
| " <tbody>\n", | |
| " <tr>\n", | |
| " <th>3528</th>\n", | |
| " <td>2015-12-21 17:00:21</td>\n", | |
| " <td>Kenyan villagers ban MP from going home using ...</td>\n", | |
| " <td>NinjaEconomics</td>\n", | |
| " </tr>\n", | |
| " <tr>\n", | |
| " <th>3529</th>\n", | |
| " <td>2015-12-21 14:00:26</td>\n", | |
| " <td>Venezuela frees Pepsi workers it arrested for ...</td>\n", | |
| " <td>NinjaEconomics</td>\n", | |
| " </tr>\n", | |
| " <tr>\n", | |
| " <th>3530</th>\n", | |
| " <td>2015-12-21 08:05:33</td>\n", | |
| " <td>This gem: https://t.co/NBGaAxJvUT @mrgunn @mat...</td>\n", | |
| " <td>NinjaEconomics</td>\n", | |
| " </tr>\n", | |
| " <tr>\n", | |
| " <th>3531</th>\n", | |
| " <td>2015-12-21 06:04:32</td>\n", | |
| " <td>The only thing that stops.a bad man with a wea...</td>\n", | |
| " <td>NinjaEconomics</td>\n", | |
| " </tr>\n", | |
| " <tr>\n", | |
| " <th>3532</th>\n", | |
| " <td>2015-12-21 01:54:40</td>\n", | |
| " <td>In every country, people overestimate the shar...</td>\n", | |
| " <td>NinjaEconomics</td>\n", | |
| " </tr>\n", | |
| " </tbody>\n", | |
| "</table>\n", | |
| "</div>" | |
| ], | |
| "text/plain": [ | |
| " time_stamp raw_text \\\n", | |
| "3528 2015-12-21 17:00:21 Kenyan villagers ban MP from going home using ... \n", | |
| "3529 2015-12-21 14:00:26 Venezuela frees Pepsi workers it arrested for ... \n", | |
| "3530 2015-12-21 08:05:33 This gem: https://t.co/NBGaAxJvUT @mrgunn @mat... \n", | |
| "3531 2015-12-21 06:04:32 The only thing that stops.a bad man with a wea... \n", | |
| "3532 2015-12-21 01:54:40 In every country, people overestimate the shar... \n", | |
| "\n", | |
| " username \n", | |
| "3528 NinjaEconomics \n", | |
| "3529 NinjaEconomics \n", | |
| "3530 NinjaEconomics \n", | |
| "3531 NinjaEconomics \n", | |
| "3532 NinjaEconomics " | |
| ] | |
| }, | |
| "execution_count": 7, | |
| "metadata": {}, | |
| "output_type": "execute_result" | |
| } | |
| ], | |
| "source": [ | |
| "tweets.tail() # display the last five rows in the dataframe" | |
| ] | |
| }, | |
| { | |
| "cell_type": "markdown", | |
| "metadata": {}, | |
| "source": [ | |
| "### What the code above does:\n", | |
| "\n", | |
| "* Displays the last five rows of the pandas dataframe we created in the 5th code cell from a CSV file\n", | |
| "\n", | |
| "* The `Out[7]:` is the displayed output from `tweets.tail()` showing the last five rows and their columns\n", | |
| "\n", | |
| "As the last row indicates, there are **3,532 individual Tweets** in the pandas dataframe that we have stored inside of the `tweets` variable." | |
| ] | |
| }, | |
| { | |
| "cell_type": "markdown", | |
| "metadata": { | |
| "colab_type": "text", | |
| "id": "3kbXP0agDwZB" | |
| }, | |
| "source": [ | |
| "---\n", | |
| "## 3. Defining the X and Y Variables Used to Train the Classifier and Test the Accuracy\n", | |
| "\n", | |
| "**In this third section:**\n", | |
| "\n", | |
| "* Our **X** and **Y** variables will defined\n", | |
| "* Then split into training and testing sets\n", | |
| "\n", | |
| "**We will now define our X and Y variables:** The `raw_text` of Tweets will be the \"**X**\" variable used to classify one user from the other (our \"**Y**\" variable)." | |
| ] | |
| }, | |
| { | |
| "cell_type": "code", | |
| "execution_count": 8, | |
| "metadata": { | |
| "collapsed": true | |
| }, | |
| "outputs": [], | |
| "source": [ | |
| "X = tweets.raw_text # the raw_text column will be used...\n", | |
| "y = tweets.username # ...to predict the username column" | |
| ] | |
| }, | |
| { | |
| "cell_type": "markdown", | |
| "metadata": {}, | |
| "source": [ | |
| "### What the code above does:\n", | |
| "\n", | |
| "* Stores the `raw_text` column in `tweets` into our `X` variable\n", | |
| "* Stores the `username` column in `tweets` into our `y` variable" | |
| ] | |
| }, | |
| { | |
| "cell_type": "code", | |
| "execution_count": 9, | |
| "metadata": { | |
| "colab": {}, | |
| "colab_type": "code", | |
| "collapsed": true, | |
| "id": "--gWnTIs0tjb" | |
| }, | |
| "outputs": [], | |
| "source": [ | |
| "X_train, X_test, y_train, y_test = train_test_split(X, y, random_state=1) # defining our train and test variables" | |
| ] | |
| }, | |
| { | |
| "cell_type": "markdown", | |
| "metadata": {}, | |
| "source": [ | |
| "### What the code above does:\n", | |
| "\n", | |
| "* Defines `X_train` as the **training** portion of the rows from the `raw_text` column we stored in `X`\n", | |
| "* Defines `X_test` as the **testing** portion of the rows from the `raw_text` column we stored in `X`\n", | |
| "* Defines `y_train` as **usernames** that correspond with the Tweets inside `X_train`\n", | |
| "* Defines `y_test` as **usernames** that correspond with the Tweets inside `X_test`" | |
| ] | |
| }, | |
| { | |
| "cell_type": "markdown", | |
| "metadata": { | |
| "colab_type": "text", | |
| "id": "hsSCl8pR_mZb" | |
| }, | |
| "source": [ | |
| "The `train_test_split` tool above splits the tweet collection into a portion that's used to *train* the model, and another that's used to *test* the accuracy of that model. `random_state`'s value simply affects *which* Tweets end up in *what* portion. `X_train` contains raw Tweet text to **train the model** by looking at what the corresponding usernames are, which are stored in the `y_train` column. The `X_test` and `y_test` get defined as content from the same respective columns (`raw_text` and `username`), but instead with rows of data that will be used to **test model accuracy**.\n", | |
| "\n", | |
| "Warning: **You never want to use the exact same tweets for training and testing** - it'll work perfectly on those tweets but fail to generalize onto new ones the classifier hasn't seen before (you can think of this as \"teaching to the test\"). Luckily, `train_test_split` prevents this exact overlap from happening.\n", | |
| "\n", | |
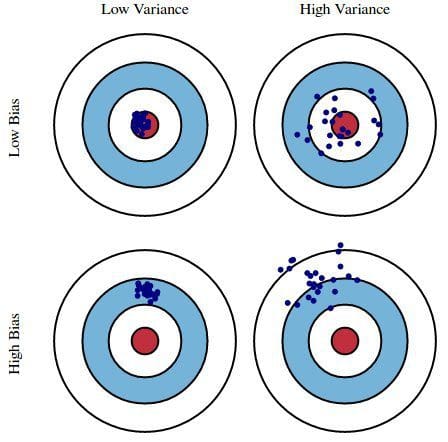
| "A classifier that works *perfectly on training data*, but *poorly on new data* it hasn't seen before is considered to have an **overfitting** problem. On the other hand, if it doesn't *predict the relationship* between two variables *as accurately* as it could, it's considered to have an **underfitting** problem.\n", | |
| "\n", | |
| "The two target images on the right column below are examples of **underfitting**, the target on the lower left is an example of **overfitting**, and the top left target is the ideal result that we want a classifier to achieve: It predicts *accurately* and not just on the *training* data.\n", | |
| "\n", | |
| " \n", | |
| "\n", | |
| "\n", | |
| "\n", | |
| " \n", | |
| "\n", | |
| "There are approaches that help you find the right balance between these two drawbacks, such as by testing the accuracy with different `random_state` values in the code above to see if you get consistent results. But for simplicity they have been omitted from this file to keep it beginner-friendly." | |
| ] | |
| }, | |
| { | |
| "cell_type": "markdown", | |
| "metadata": {}, | |
| "source": [ | |
| "---\n", | |
| "## 4. Vectorize the Raw Text of the Tweets from Each User\n", | |
| "\n", | |
| "**In this fourth section:**\n", | |
| "\n", | |
| "* We will store `CountVectorizer()` inside of `vect` so we don't have to type as much\n", | |
| "* `X_train_dtm` will be defined as the *word counts* of the `raw_text` content stored inside `X_train`\n", | |
| "* `X_test_dtm` will be defined as the *word counts* of the `raw_text` content stored inside `X_test`\n", | |
| "\n", | |
| "Raw text from a Twitter post doesn't really have any structure a computer can easily work with. This is where **vectorization** comes in. Each *unique word* becomes a *vector* (direction) that stores the *number of times* it appears (magnitude).\n", | |
| "\n", | |
| "I mentioned *document-term matrices* earlier in this notebook as a record that `CountVectorizer` generates of *how often* different words appear. Below is the vectorization code that \"transforms\" the training (X_train) and testing (X_test) data (which is just raw Tweet text) into something with structure:" | |
| ] | |
| }, | |
| { | |
| "cell_type": "code", | |
| "execution_count": 10, | |
| "metadata": { | |
| "colab": {}, | |
| "colab_type": "code", | |
| "collapsed": true, | |
| "id": "-25ZFsqW29Yf" | |
| }, | |
| "outputs": [], | |
| "source": [ | |
| "vect = CountVectorizer()" | |
| ] | |
| }, | |
| { | |
| "cell_type": "markdown", | |
| "metadata": {}, | |
| "source": [ | |
| "### What the code above does:\n", | |
| "\n", | |
| "* Allows us to call `CountVectorizer()` by only typing `vect`, just for convenience purposes" | |
| ] | |
| }, | |
| { | |
| "cell_type": "code", | |
| "execution_count": 11, | |
| "metadata": { | |
| "collapsed": true | |
| }, | |
| "outputs": [], | |
| "source": [ | |
| "X_train_dtm = vect.fit_transform(X_train)\n", | |
| "X_test_dtm = vect.transform(X_test)" | |
| ] | |
| }, | |
| { | |
| "cell_type": "markdown", | |
| "metadata": {}, | |
| "source": [ | |
| "### What the code above does:\n", | |
| "\n", | |
| "* Uses `CountVectorizer()` (stored in `vect`) to perform a vocabulary count on the contents of `X_train`\n", | |
| "* Uses `CountVectorizer()` (stored in `vect`) to perform a vocabulary count on the contents of `X_text`" | |
| ] | |
| }, | |
| { | |
| "cell_type": "markdown", | |
| "metadata": {}, | |
| "source": [ | |
| "`X_train_dtm` has been defined as a **document-term matrix** of the \"vectorized\" (quantified) *training* text (`X_train` contains raw tweet text for model training). `X_test_dtm` stores similar data, but for *testing* purposes.\n", | |
| "\n", | |
| "Here's an image that should make it clear what just happened. Think of each Tweet as a \"document\" and imagine how this rows/columns data format could uncover statistical patterns that distinguish one user from another. What we end up with is a statistical \"fingerprint\" of how both users tend to use various words at different rates:\n", | |
| "\n", | |
| "\n", | |
| "\n", | |
| "In the next section the algorithm we will use (`MultinomialNB`) will take in the *word counts* from the `raw_text` of the Tweets stored in `X_train_dtm`, and the corresponding usernames for those Tweets that are stored inside `y_train`. **The differences between how often each user uses certain words will be what the algorithm tries to \"learn\" from in order to infer who wrote any given Tweet used to test it's accuracy.**" | |
| ] | |
| }, | |
| { | |
| "cell_type": "markdown", | |
| "metadata": {}, | |
| "source": [ | |
| "---\n", | |
| "## 5. Fit the Training Tweets, Test the Model, and Display the Accuracy\n", | |
| "\n", | |
| "**In this fifth section:**\n", | |
| "\n", | |
| "* We will store our algorithm `MultinomialNB()` inside of `nb` to reduce needed typing\n", | |
| "* We will feed the content stored in `X_train_dtm` and `y_train` into our algorithm (stored in `nb`)\n", | |
| "* `y_pred_users` will store the predicted usernames that the trained algorithm generated from the test data in `X_test_dtm`\n", | |
| "* `metrics` will compare the *true usernames* for **test** Tweets (fed in from `y_test`) and *predicted usernames* (fed in from `y_pred_users`) that the trained algorithm predicted to generate an accuracy percentage, then store that inside `result`\n", | |
| "* The last line of code will take the integer stored in `result` and display it in a clearer format" | |
| ] | |
| }, | |
| { | |
| "cell_type": "markdown", | |
| "metadata": {}, | |
| "source": [ | |
| "Now for the fun part, we get to test the accuracy of the model. **Bear in mind that the results are with *default* settings; for example things like `CountVectorizer` can be trained/tested with different settings to boost accuracy.** " | |
| ] | |
| }, | |
| { | |
| "cell_type": "code", | |
| "execution_count": 12, | |
| "metadata": {}, | |
| "outputs": [ | |
| { | |
| "data": { | |
| "text/plain": [ | |
| "MultinomialNB(alpha=1.0, class_prior=None, fit_prior=True)" | |
| ] | |
| }, | |
| "execution_count": 12, | |
| "metadata": {}, | |
| "output_type": "execute_result" | |
| } | |
| ], | |
| "source": [ | |
| "nb = MultinomialNB() # define nb as the Multinomial Naive Bayes algorithm we imported earlier\n", | |
| "nb.fit(X_train_dtm, y_train) # fit the algorithm to the training data" | |
| ] | |
| }, | |
| { | |
| "cell_type": "markdown", | |
| "metadata": {}, | |
| "source": [ | |
| "### What the code above does:\n", | |
| "\n", | |
| "* Stores `MultinomialNB()` (our imported algorithm for classifying which user wrote what Tweet) inside `nb`\n", | |
| "* Fits Tweet word counts (stored in `X_train_dtm`) and the usernames for those tweets (stored in `y_train`) to the algorithm (stored in `nb`), which results in a trained model for predicting which of two people wrote a given Tweet" | |
| ] | |
| }, | |
| { | |
| "cell_type": "code", | |
| "execution_count": 13, | |
| "metadata": { | |
| "collapsed": true | |
| }, | |
| "outputs": [], | |
| "source": [ | |
| "y_pred_users = nb.predict(X_test_dtm) # stores what usernames the algorithm predicts from the test dtm" | |
| ] | |
| }, | |
| { | |
| "cell_type": "markdown", | |
| "metadata": {}, | |
| "source": [ | |
| "### What the code above does:\n", | |
| "\n", | |
| "* The algorithm we just trained (`nb`) predicts which username belongs to any given Tweet using the word count data stored inside `X_test_dtm`, the result of which is then stored inside `y_pred_users`" | |
| ] | |
| }, | |
| { | |
| "cell_type": "code", | |
| "execution_count": 14, | |
| "metadata": {}, | |
| "outputs": [ | |
| { | |
| "data": { | |
| "text/plain": [ | |
| "'Classifier accuracy: 92.53%'" | |
| ] | |
| }, | |
| "execution_count": 14, | |
| "metadata": {}, | |
| "output_type": "execute_result" | |
| } | |
| ], | |
| "source": [ | |
| "# calculate accuracy, how often does the predicted user (y_pred_class) match the true username (y_test)?\n", | |
| "result = metrics.accuracy_score(y_test, y_pred_users)\n", | |
| "\n", | |
| "# this is a raw string of text followed by the contents of \"result\" formatted into a traditional percentage\n", | |
| "'Classifier accuracy: ' + str(result)[2:4] + '.' + str(result)[4:6] + '%'" | |
| ] | |
| }, | |
| { | |
| "cell_type": "markdown", | |
| "metadata": {}, | |
| "source": [ | |
| "### What the code above does:\n", | |
| "\n", | |
| "* `metrics.accuracy_score` takes in and compares the *usernames* stored in two variables to generate an accuracy score (`y_test` has the correct names for test Tweets and `y_pred_users` has the ones the algorithm predicted for the same Tweets), which is then stored in `result`\n", | |
| "* A string of text is combined with two string versions of the score, both of which are sliced to get the digits for an accuracy percentage" | |
| ] | |
| }, | |
| { | |
| "cell_type": "markdown", | |
| "metadata": { | |
| "colab_type": "text", | |
| "id": "bWA-XDJ8_jTA" | |
| }, | |
| "source": [ | |
| "It's just over 92% accurate in distinguishing one Twitter user from another. Bear in mind that I haven't even used any special parameter settings to boost the accuracy even further. I left those out to keep the code simple to non-programmers.\n", | |
| "\n", | |
| "What the `result` variable contains is the following: `0.9253393665158371`\n", | |
| "\n", | |
| "**To convert that figure into the last sentence output, there are seven steps:** \n", | |
| "\n", | |
| "* create a string (raw characters) for the first part of the sentence\n", | |
| "* convert the content of `result` into a string (instead of a float)\n", | |
| "* grab the third and fourth characters (`92` using `[2:4]`) \n", | |
| "* add a period (`'.'`)\n", | |
| "* convert `result` into a string again\n", | |
| "* take the fifth and sixth characters from that string (`53` using `[4:6]`)\n", | |
| "* then add a percentage sign (`%`)\n", | |
| "\n", | |
| "The final result is displayed as a single sentence string." | |
| ] | |
| }, | |
| { | |
| "cell_type": "markdown", | |
| "metadata": {}, | |
| "source": [ | |
| "---\n", | |
| "### Why Machine Learning Saved Us Time at the Task:\n", | |
| "\n", | |
| "To appreciate why machine learning is beneficial for the task this tutorial was coded for, consider two scenarios - determining **if a number is even** versus determining **which person wrote a Twitter post**. In the case of checking if a number is even or not, you only need to write enough code to answer the following: **Do you end up with a *whole integer* when dividing the input by two?**\n", | |
| "\n", | |
| "So any programming language would simply need to take the following approach: **If** dividing an integer by two leads to a whole number, **Then** return `Even` - **Else** return `Odd`\n", | |
| "\n", | |
| "The corresponding python code for this problem is simple for even non-programmers to follow:\n", | |
| "\n", | |
| "```python\n", | |
| "def is_even(n):\n", | |
| " if n % 2 == 0: # checks if dividing by two leads to a whole number\n", | |
| " return \"Even\"\n", | |
| " else:\n", | |
| " return \"Odd\"\n", | |
| "```\n", | |
| "\n", | |
| "This is obviously a *low-dimensional* problem (even or odd), and relatively easy to code for in most programming languages. Most will allow you to solve the problem with five or fewer lines of code.\n", | |
| "\n", | |
| "But consider a scenario involving *high-dimensional* data, such as raw text. Text can be *vectorized* - that is, quantified by things like how often unique words, or even multi-word sequences appear in a document. Those corresponding values can be used as a \"statistical fingerprint\" of how to distinguish text samples from each other. **But as you can imagine, writing a series of \"if, then, else\" statements to account for every possible arrangement of characters in a document (or social media post) is unworkable.**\n", | |
| "\n", | |
| "This notebook used a *supervised machine learning* approach to the task at hand. Rather than try to write separate conditional statements for every possible arrangement of 140 characters (the Tweets were downloaded in the spring of 2016 before Twitter raised their limit to 280), you simply train it with sample data coming from the users you wish to distinguish. **There are literally orders of magnitude more ways of writing a tweet than there are atoms in the entire solar system (10<sup>250</sup> combinations using alphanumeric characters in English alone), it would be impractical to write a conditional statement for each of these!** Machine learning on the other hand will only require that we have enough labeled examples to train a text classifier to \"fingerprint\" one Twitter user from another.\n", | |
| "\n", | |
| "A supervised machine learning model used for classification is the result of the following:\n", | |
| "\n", | |
| "* **Input data:** The labeled samples to train the model (Tweets with usernames)\n", | |
| "* **Categories:** What the data will be sorted into (which of two people wrote them)\n", | |
| "* **Features:** What the data will be sorted by (vocabulary counts of the Tweet text)\n", | |
| "* **Algorithm:** What math procedure will do the sorting (Multinomial Naive Bayes)\n", | |
| "* **Optimization:** What methods are used to fine tune the above (we didn't do this)" | |
| ] | |
| }, | |
| { | |
| "cell_type": "markdown", | |
| "metadata": {}, | |
| "source": [ | |
| "---\n", | |
| "# Comprehension Quiz:\n", | |
| "### Testing what you learned from the code and documentation above" | |
| ] | |
| }, | |
| { | |
| "cell_type": "markdown", | |
| "metadata": {}, | |
| "source": [ | |
| "1. A **Jupyter Notebook** consists of what two kinds of cells?\n", | |
| "\n", | |
| "2. What does the `Pandas` import allow us to work with? (hint: r's and c's)\n", | |
| "\n", | |
| "3. What is a **CSV file** and what columns does each row contain in the one we loaded into this notebook?\n", | |
| "\n", | |
| "4. The CSV file is converted into what format before being stored in `tweets`? (hint: p-nd-s d-t-fr-m-)\n", | |
| "\n", | |
| "5. What will `tweets.head()` and `tweets.tail()` output?\n", | |
| "\n", | |
| "6. In this notebook, what does `CountVectorizer` \"quantify\" raw text by?\n", | |
| "\n", | |
| "7. What is a **document-term matrix** and what was stored in this format?\n", | |
| "\n", | |
| "8. What two things does `train_test_split` divide data into, and what is the purpose of each?\n", | |
| "\n", | |
| "9. What is `MultinomialNB` used to do? (don't worry about knowing the math behind it, just the purpose)\n", | |
| "\n", | |
| "10. What does `metrics` tell us about our classifier?\n", | |
| "\n", | |
| "11. The contents of which column in `tweets` are used to predict what other column?\n", | |
| "\n", | |
| "12. Describe what content gets stored in the `X_train` variable.\n", | |
| "\n", | |
| "13. Describe what content gets stored in the `X_test` variable.\n", | |
| "\n", | |
| "14. Describe what content gets stored in the `y_train` variable.\n", | |
| "\n", | |
| "15. Describe what content gets stored in the `y_test` variable.\n", | |
| "\n", | |
| "16. Which of those four variables does the algorithm never see directly? (hint: it's not used to train it or predict usernames with)\n", | |
| "\n", | |
| "17. `random_state` in the fifth code cell affects which rows of Tweets end up in which two splits of data?\n", | |
| "\n", | |
| "18. What do **overfitting** and **underfitting** mean when it comes to training a classifier?\n", | |
| "\n", | |
| "19. What kind of rows/columns structure do `X_train_dtm` and `X_test_dtm` each contain?\n", | |
| "\n", | |
| "20. What does `nb` get defined as in the *twelfth* code cell?\n", | |
| "\n", | |
| "21. What do the two variables each contain that the answer to the previous question gets \"fitted\" to?\n", | |
| "\n", | |
| "22. `y_pred_class` stores the result of `nb.predict(X_test_dtm)`, but what does that result consist of? (hint: p--d---ed u---n---s)\n", | |
| "\n", | |
| "23. In the last code cell (8), what two variables does `metrics` compare to test model accuracy?\n", | |
| "\n", | |
| "24. What *seven steps* are there to producing that final sentence output that tells you the accuracy result?\n", | |
| "\n", | |
| "25. Why does **machine learning** save you time and effort with this notebook's type of problem compared to **if-then-else** statements?" | |
| ] | |
| }, | |
| { | |
| "cell_type": "markdown", | |
| "metadata": {}, | |
| "source": [ | |
| "---\n", | |
| "## What Now?\n", | |
| "\n", | |
| "A more comprehensive notebook would also contain the following (and potentially several more considerations):\n", | |
| "\n", | |
| "* More **classification algorithms** would be imported to test (Logistic Regression, Stochastic Gradient Descent, ensemble techniques, etc)\n", | |
| "\n", | |
| "* Additional **CountVectorizer settings** would be put to use (n-grams, min/max features, converting to lowercase, ignoring \"stop\" words, etc)\n", | |
| "\n", | |
| "* **GridSearchCV** often plays a key role in trying a *range of possible settings* for the above (and more) to find what delivers highest accuracy. It also conducts *multiple* train/test splits on the same data to avoid overfitting. This library can do in *minutes* what can otherwise take hours to do.\n", | |
| "\n", | |
| "**But most importantly, this tutorial didn't touch on the most time-consuming element of machine learning: Preparing the CSV file that gets read in with Pandas**. That's right, you'll spend the vast majority of your time extracting data through web scraping, APIs (application programming interface, I used Twitter's API in this case), or even extensive online searches for files that contain what you need. You'll often have to spend additional time \"cleaning\" that data (depending on what you're working with), or even labeling it (especially when doing text classification).\n", | |
| "\n", | |
| "I was lucky to have found a script that allowed me to download the Twitter feeds used in this tutorial in a way that only required that I join two CSV files into one. The result was a spreadsheet that contained the raw Tweet text used to train the model and predict usernames with, and already had username labels for each Tweet. This script can be found here: https://gist.github.com/yanofsky/5436496\n", | |
| "\n", | |
| "To use it, you'll actually need to make a Twitter account and setting up some authentication credentials associated with your account. **Full disclosure - this is literally the only reason I even joined Twitter in the first place: [@AnalyticAscent](https://twitter.com/analyticascent)**" | |
| ] | |
| }, | |
| { | |
| "cell_type": "markdown", | |
| "metadata": {}, | |
| "source": [ | |
| "Now imagine if you wanted to check documents to see if they contain certain pieces of info or not, rather than attribute authorship. Getting high accuracy can be even easier because the absence or presence of certain keywords alone can be enough for a classifier to determine if something is mentioned at all or not.\n", | |
| "\n", | |
| "**This notebook is essentially a sample of what a much bigger project in the works is capable of doing...**" | |
| ] | |
| } | |
| ], | |
| "metadata": { | |
| "colab": { | |
| "collapsed_sections": [], | |
| "include_colab_link": true, | |
| "name": "text_classification_demo.ipynb", | |
| "provenance": [], | |
| "version": "0.3.2" | |
| }, | |
| "kernelspec": { | |
| "display_name": "Python 3", | |
| "language": "python", | |
| "name": "python3" | |
| }, | |
| "language_info": { | |
| "codemirror_mode": { | |
| "name": "ipython", | |
| "version": 3 | |
| }, | |
| "file_extension": ".py", | |
| "mimetype": "text/x-python", | |
| "name": "python", | |
| "nbconvert_exporter": "python", | |
| "pygments_lexer": "ipython3", | |
| "version": "3.6.8" | |
| } | |
| }, | |
| "nbformat": 4, | |
| "nbformat_minor": 2 | |
| } |
I ran through this and it was very instructional. I came away with a few things:
This was super helpful; to have a workable, explained code is meaningful. The concepts are explained well. So on understanding that code...
-
Pandas, numpy, sklearn are all new to me, and the intros here helps steer me on what to learn next. Googling sklearn lead me to scikit-learn.org which has some introductory information others beginners might gain from (I haven't gone through it yet).
-
There is more for me to learn about random_state. Changing that int seems to create very reliable accuracy results. I was thinking that a more random sample of traint/test selection would generate very slightly different metric scores on each run; in fact, they are consistent on every run for a given state value.
*The "brains" of it appear to be in the vectorizing and algorithm, and the choices made in those would affect the outcome in more complex scenarios.
Today I uploaded what comes very close to being the final version of the notebook.
There may be enough spelling/grammatical errors to warrant another revision, but one thing I'm tempted to do is include links to the official documentation for each of the libraries used so people can learn more about what they do and the parameters that can be changed. I'm also trying to think of a more clear and concise way to describe to readers what document-term matrices are.
At this point I can't really think of any other major ways to improve it without making it too wordy for newcomers or not detailed enough for the same group.
@2112bytes - Those three libraries are more or less the three main libraries used in most machine learning projects (although what specific tools are needed from sklearn will depend on what you're trying to do).
When it comes to random_state values, it's been hard for me to find a value that results in accuracy below 91% or above 93%. For example, setting it to 15 results in 91.06% and 100 results in 92.98%. Part of why the results appear to be so consistent is that the two users truly do have very different ways of talking about the same thing (such as how often they link to things), along with the fact that the amount of available training samples is quite high.
By default, train_test_split will use 75% of the sample data to train the model and 25% to test it. That's one of the things made clear in the online documentation that I probably need to add in the next revision.
I won't post a new version until I'm sure it'll be the last. Thus far two coders (yourself included) and one non-coder has given me feedback, so I plan on seeking more input (especially from non-coders) until I can't find any more room for improvement. Really appreciate the feedback I've gotten from you and others thus far!
Some context for anyone that happens to stumble across this:
I've put this together as a way to give a few people I know (most of whom have never coded before) an idea of how text classification works. Reading through the markdown documentation and the code cells in the above post should take most people 30 minutes or so to do, but I'm not yet sure how long it would take a non-coder to understand why the code does what it does.
Any questions from people that happen to stumble upon this page are more than welcome. I plan on including this as part of a Github repo meant to serve as a Python crash course: https://github.com/analyticascent/python-inflection
The end goal of that repo is for someone with little or no coding experience to be able to pick up enough Python to be dangerous in ten days or less.