Skip to content

Instantly share code, notes, and snippets.

@andmcgregor
Last active April 11, 2017 18:11
Show Gist options
  • Star 1 You must be signed in to star a gist
  • Fork 4 You must be signed in to fork a gist
  • Save andmcgregor/6386263 to your computer and use it in GitHub Desktop.
Save andmcgregor/6386263 to your computer and use it in GitHub Desktop.
Map Widget for Dashing Framework

Dashing Map Widget

Live demo: http://dashing-map.herokuapp.com/

Created by: @andmcgregor

About

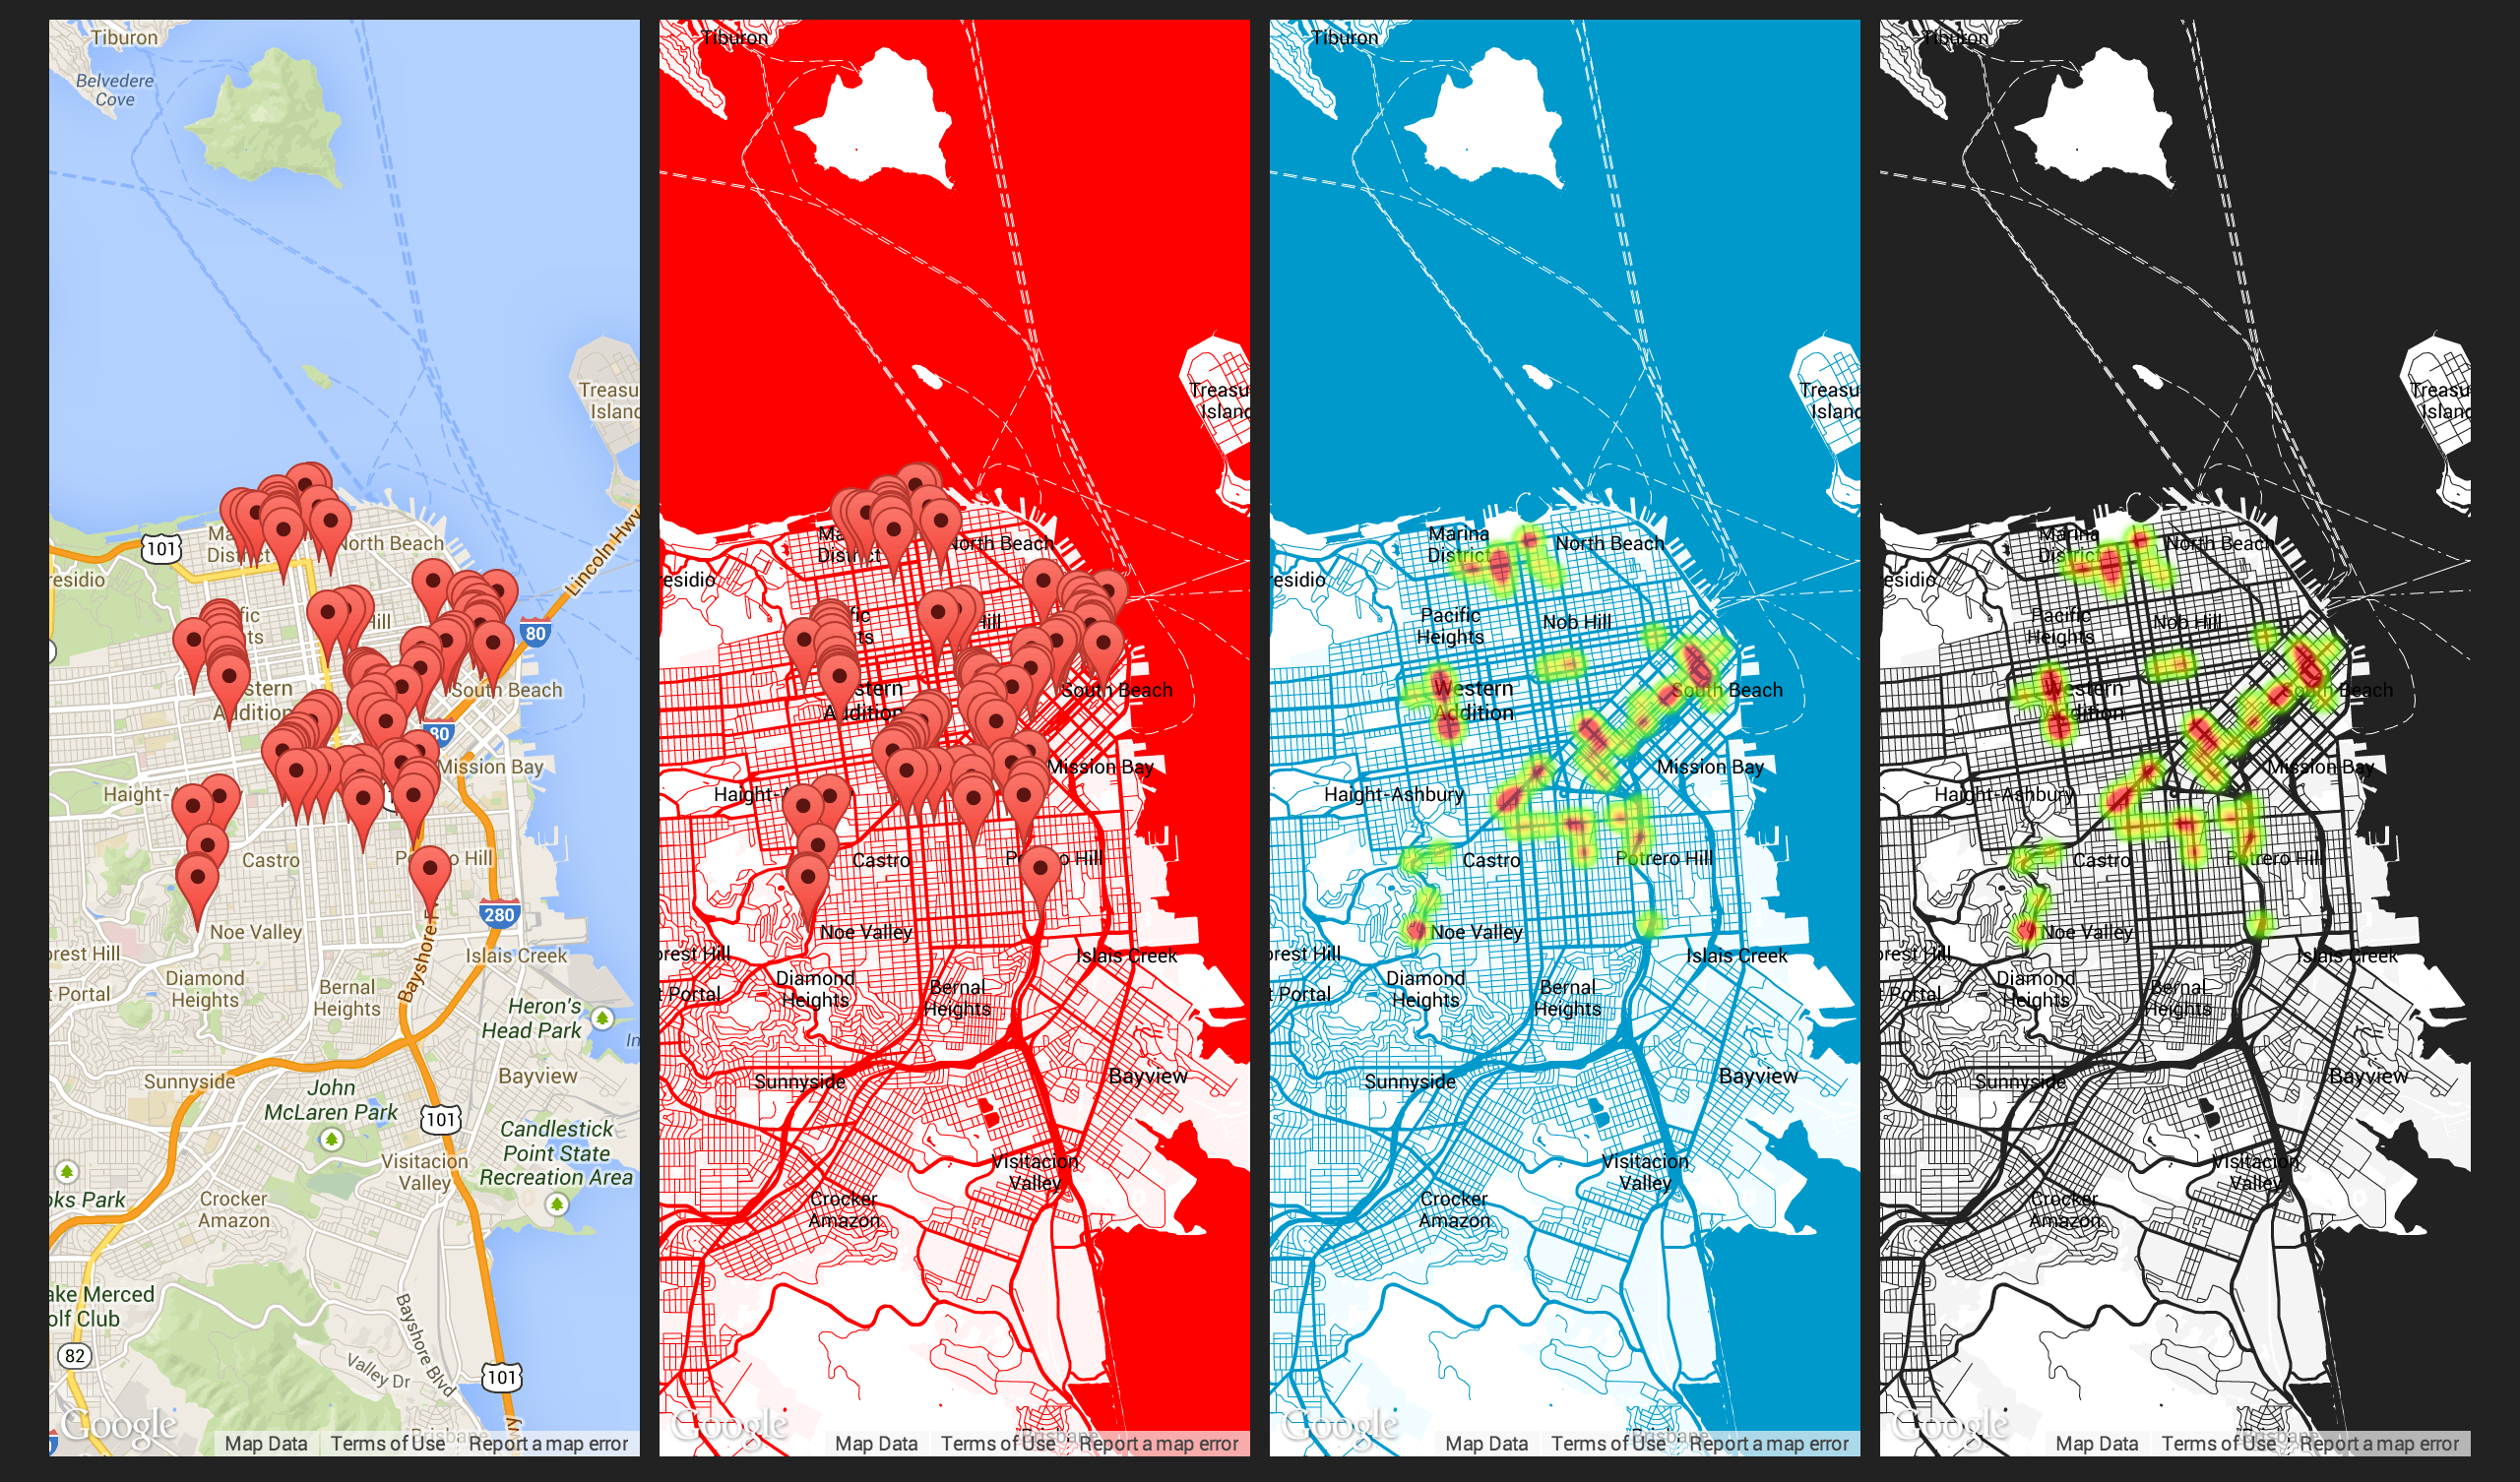
Uses the Google Maps API to display latitude and longitude coordinates.

Screenshot

Dashing map

Installation

Copy the following files into a directory named map within the widgets directory of your Dashing app.

Or type dashing install 6386263 from your project directory.

Add the following line of code to your layout.erb file:

<script src="http://maps.googleapis.com/maps/api/js?key=<%= ENV['GOOGLE_MAPS_KEY'] %>&sensor=false&libraries=visualization"></script>

And finally set the environment variable GOOGLE_MAPS_KEY with your Google Maps API key.

Using the widget

Include a widget with a data-view of Map. You can also use data-color to color the map and set data-type to heat to display a heatmap rather than markers

<li data-row="1" data-col="1" data-sizex="3" data-sizey="2">
  <div data-id="map" data-view="Map" data-title="Map" data-type="heat" data-color="#222222"></div>
</li>

License

This widget is licensed under a Creative Commons Attribution-NonCommercial-ShareAlike 3.0 license.

class Dashing.Map extends Dashing.Widget
ready: ->
$(@node).removeClass('widget')
color = $(@node).data("color")
if color
style = [
{
"featureType": "water",
"stylers": [
{ "color": color }
]
},{
"featureType": "road",
"stylers": [
{ "color": color },
{ "weight": 0.5 }
]
},{
"featureType": "poi.government",
"stylers": [
{ "lightness": 95 },
{ "visibility": "off" }
]
},{
"featureType": "transit",
"stylers": [
{ "color": "#ffffff" }
]
},{
"featureType": "transit",
"elementType" : "geometry",
"stylers": [
{ "weight": 0.5 }
]
},{
"featureType": "transit",
"elementType": "labels",
"stylers": [
{ "visibility": "off" }
]
},{
"featureType": "road",
"elementType": "labels",
"stylers": [
{ "visibility": "off" }
]
},{
"featureType": "poi",
"elementType": "labels",
"stylers": [
{ "visibility": "off" }
]
},{
"featureType": "administrative.land_parcel" },{
"featureType": "poi.park",
"stylers": [
{ "lightness": 90 },
{ "color": "#ffffff" }
]
},{
"featureType": "landscape",
"stylers": [
{ "color": "#ffffff" },
{ "visibility": "on" }
]
},{
"featureType": "poi.park",
"stylers": [
{ "color": "#ffffff" }
]
},{
"featureType": "landscape.man_made",
"stylers": [
{ "color": color },
{ "lightness": 95 }
]
},{
"featureType": "poi",
"stylers": [
{ "visibility": "on" },
{ "color": "#ffffff" }
]
},{
"featureType": "poi",
"elementType": "labels",
"stylers": [
{ "visibility": "off" }
]
},{
"featureType": "landscape",
"elementType": "labels",
"stylers": [
{ "visibility": "off" }
]
},{
"featureType": "administrative.province",
"elementType": "labels",
"stylers": [
{ "visibility": "off" }
]
},{
"elementType": "administrative.locality",
"elementType": "labels",
"stylers": [
{ "color": "#000000" },
{ "weight": 0.1 }
]
},{
"featureType": "administrative.country",
"elementType": "labels.text",
"stylers": [
{ "color": "#000000" },
{ "weight": 0.1 }
]
},{
"featureType": "administrative.country",
"elementType": "geometry",
"stylers": [
{ "color": color },
{ "weight": 1.0 }
]
},{
"featureType": "administrative.province",
"elementType": "geometry",
"stylers": [
{ "color": color },
{ "weight": 0.5 }
]
},{
"featureType": "water",
"elementType": "labels",
"stylers": [
{ "visibility": "off" }
]
}
]
else
[]
options =
zoom: 2
center: new google.maps.LatLng(30, -98)
disableDefaultUI: true
draggable: false
scrollwheel: false
disableDoubleClickZoom: true
styles: style
mapTypeId: google.maps.MapTypeId.ROADMAP
@map = new google.maps.Map $(@node)[0], options
@heat = []
@markers = []
onData: (data) ->
return unless @map
if $(@node).data("type") == 'heat'
marker.set('map', null) for marker in @heat
@markers = []
@markers.push new google.maps.LatLng(marker[0],marker[1]) for marker in data.markers
pointArray = new google.maps.MVCArray @markers
@heat.push new google.maps.visualization.HeatmapLayer
data: pointArray
map: @map
else
marker.set('map', null) for marker in @markers
@markers = []
for marker in data.markers
marker_object = new google.maps.Marker
position: new google.maps.LatLng(marker[0],marker[1])
map: @map
@markers.push marker_object
if @markers.length == 1
@map.set('zoom', 9)
@map.set('center', @markers[0].position)
else
bounds = new google.maps.LatLngBounds
bounds.extend(marker.position || marker) for marker in @markers
@map.panToBounds(bounds)
@map.fitBounds(bounds)
<div data-bind="map"></div>
p {
color: #000;
}
#map {
width: 100%;
height: 100%;
}
.widget-map {
background: #fff;
text-align: center;
width: 100%;
display: table-cell;
vertical-align: middle;
}
@apocope
Copy link

apocope commented Feb 7, 2014

Something like this will input markers.

SCHEDULER.every '1m', :first_in => '0s' do
  markers = [[40.72046961,-74.00897631],[40.72499544,-74.01220975]]
  send_event('map', markers: markers)
end

@derwin12
Copy link

Comment out (or remove) line 170 above due to bug found
marker.set('map', null) for marker in @Markers

@MrZaph
Copy link

MrZaph commented Sep 10, 2014

Does anyone know how we could possibly add a traffic Layer. It would be fantastic to be able to see traffic info between 2 points. Even better if we could also display the Google estimated time on the widget also.

@MikeYEG
Copy link

MikeYEG commented Apr 11, 2017

@MrZaph were you able to use this to get a traffic layer?

Sign up for free to join this conversation on GitHub. Already have an account? Sign in to comment