Last active
September 4, 2019 10:19
-
-
Save cavedave/6426ad7167200c489100be426fe1a37f to your computer and use it in GitHub Desktop.
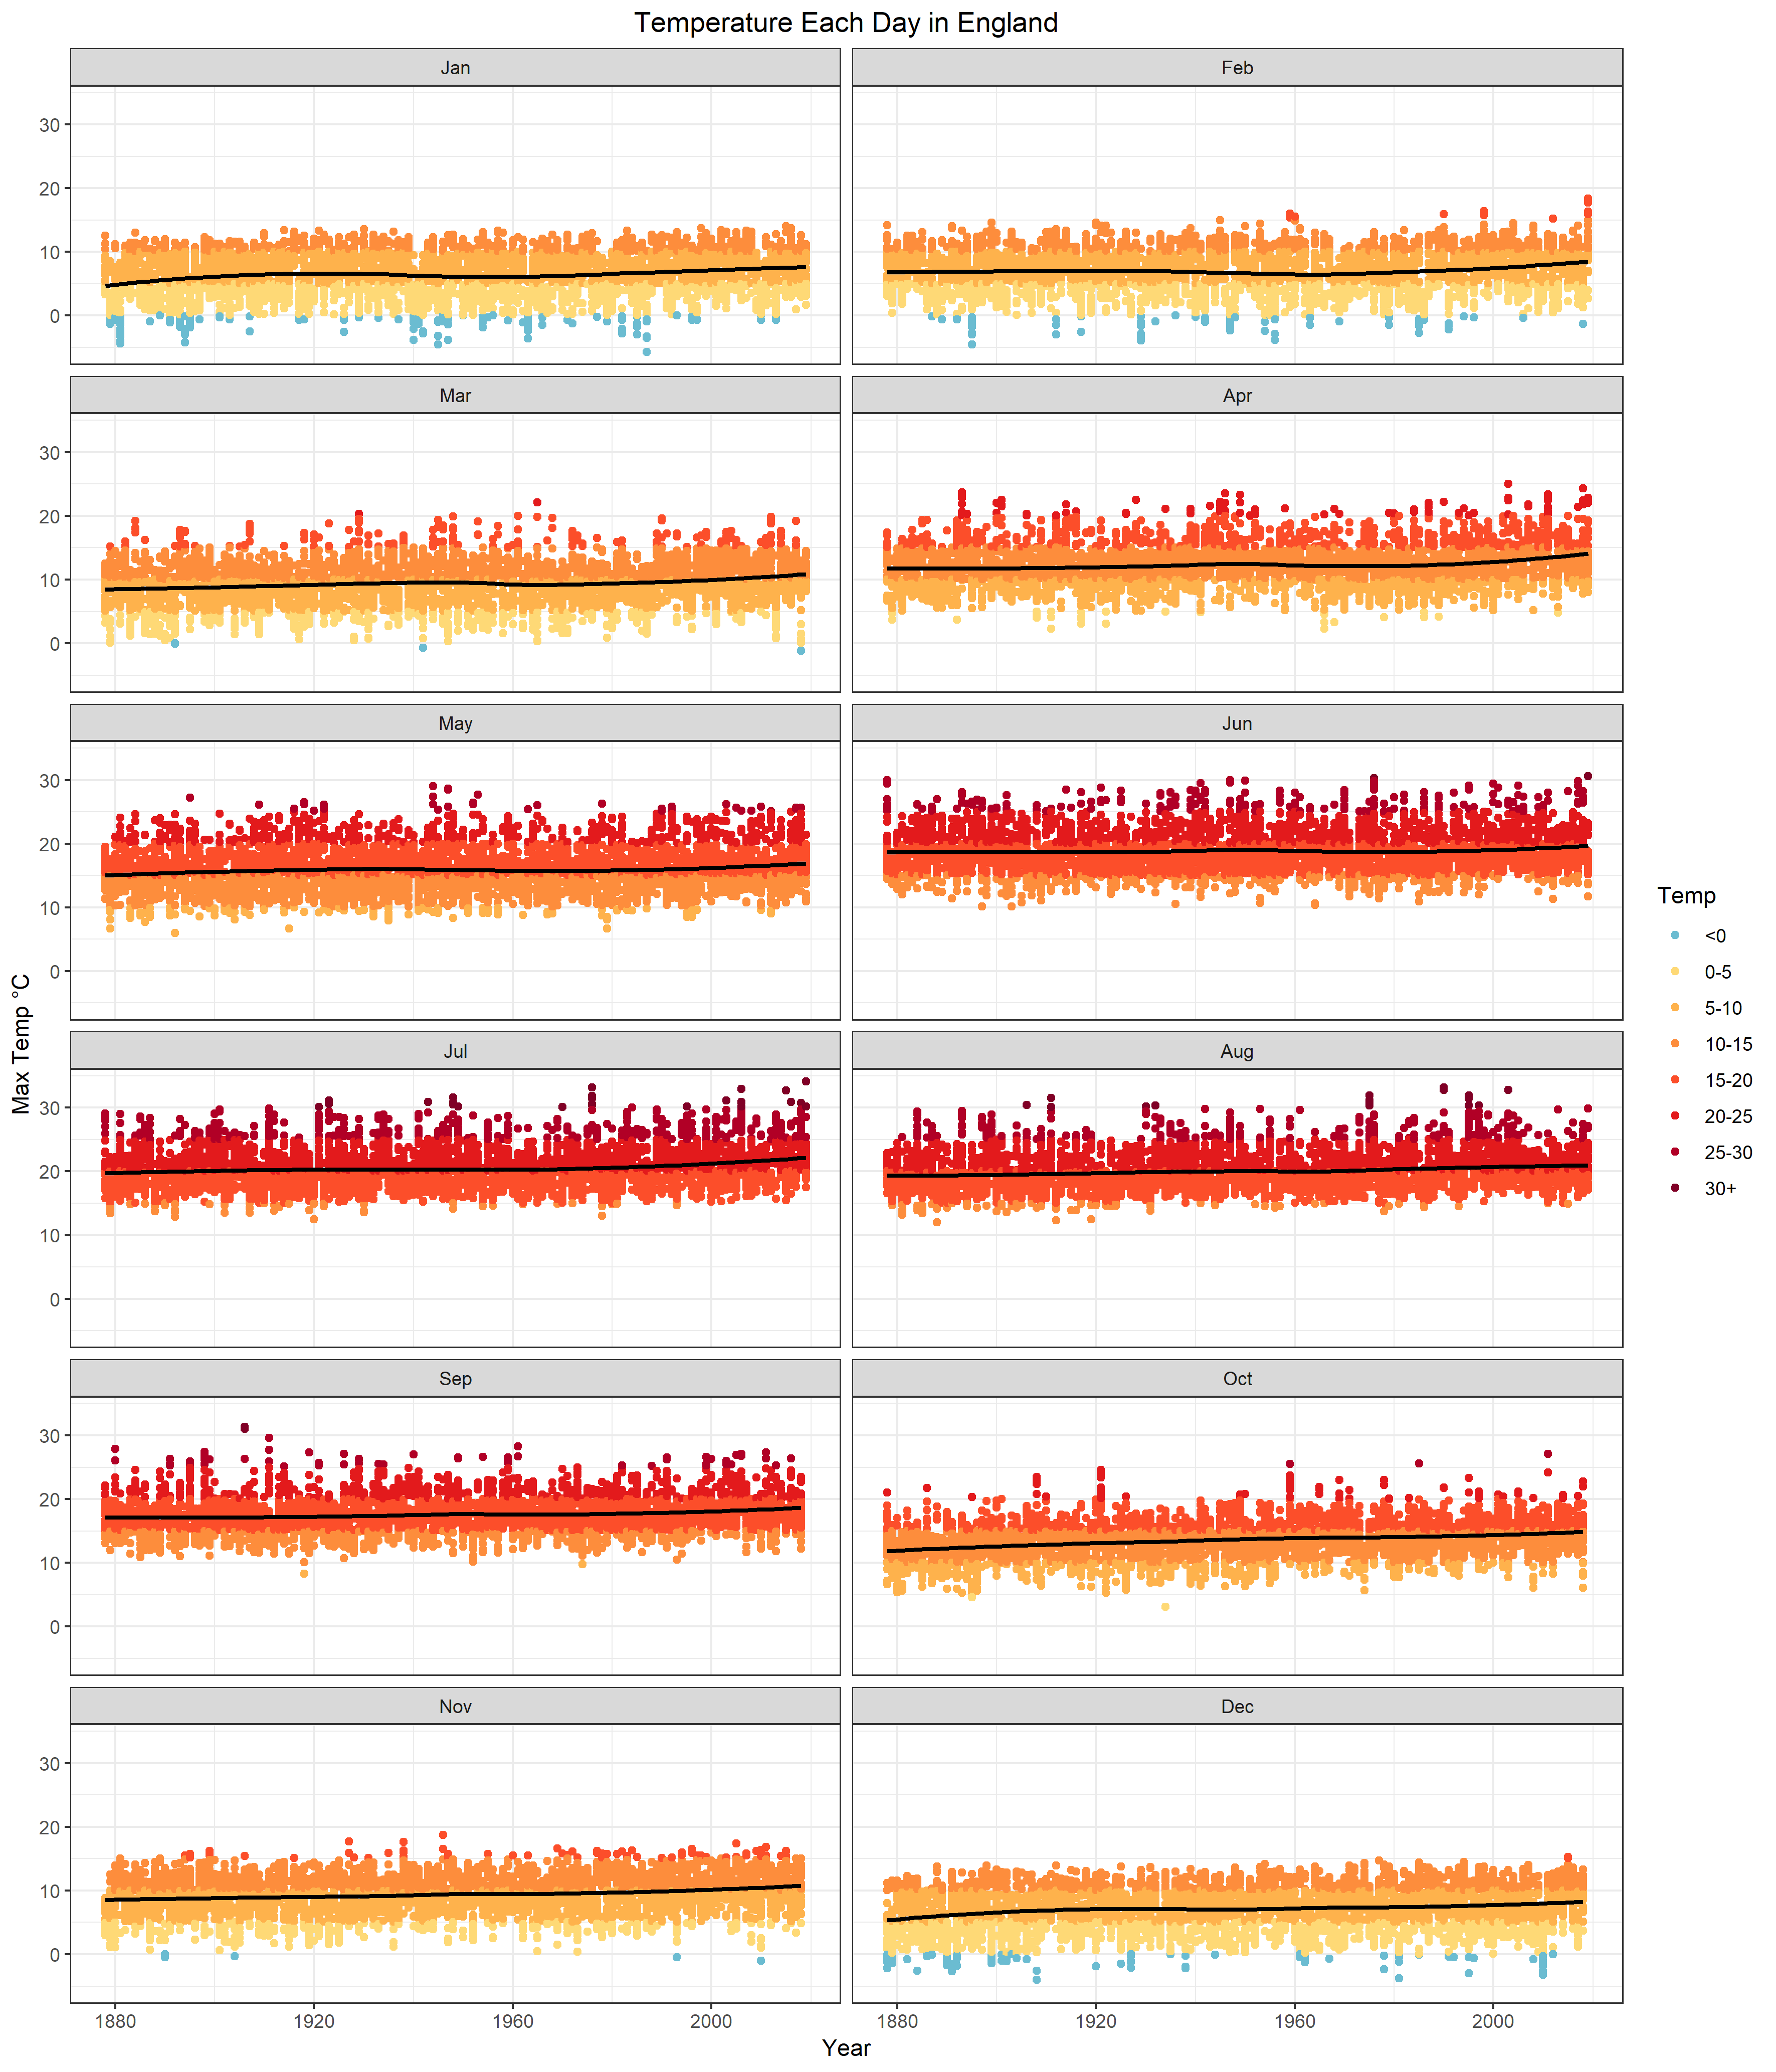
Facet of all the temperatures in the uk since 1878 using data from Hadcet https://www.metoffice.gov.uk/hadobs/hadcet/cetmaxdly1878on_urbadj4.dat ggplot2
This file contains bidirectional Unicode text that may be interpreted or compiled differently than what appears below. To review, open the file in an editor that reveals hidden Unicode characters.
Learn more about bidirectional Unicode characters
| library(tidyverse) | |
| library(lubridate) | |
| library(RCurl) | |
| #URL <- "https://www.metoffice.gov.uk/hadobs/hadcet/cetmaxdly1878on_urbadj4.dat" | |
| cet2 <- read.table("1878junjulyaug.txt", sep = "", header = FALSE, | |
| fill = TRUE)#),na.string = c(-99.99, -99.9, -999)) | |
| colnames(cet2) <- c("year","day","Jan","Feb","Mar","Apr","May","Jun","Jul","Aug","Sep","Oct","Nov","Dec") | |
| data_long <- gather(cet2, month, t, Jan:Dec)#, factor_key=TRUE) | |
| data_long$t<-(data_long$t/10) | |
| #head(data_long) | |
| df_raw<-data_long | |
| #Make divisions by time and temperature | |
| df_raw$Periods <- cut(df_raw$year, breaks=c(1877,1900,1920,1940,1960,1980,2000,2018 ,Inf), labels=c("1878-1900","1901-1920","1921-1940","1941-1960","1961-1980","1981-2000","2001-2018","2019")) | |
| df_raw$Temp <- cut(df_raw$t, breaks=c(-20,0,5,10,15,20,25,30, Inf), labels=c("<0","0-5","5-10","10-15","15-20","20-25","25-30","30+")) | |
| hot <- c("#6BBCD1","#fed976","#feb24c","#fd8d3c","#fc4e2a","#e31a1c","#b10026","#800026") | |
| #Make months go in time order not alphabetical | |
| df_raw$month = factor(df_raw$month, levels = month.abb) | |
| #get rid of na's | |
| df_raw<-filter(df_raw, t > -99 )%>% | |
| na.omit() | |
| #Make a picture | |
| p<-ggplot(df_raw, aes(x=year, y=t, color=Temp )) + geom_point() | |
| p=p+ggtitle("Temperature Each Day in England") +xlab("Year") + ylab("Max Temp °C") | |
| p=p+geom_smooth(method=loess, colour="black") | |
| p=p + scale_colour_manual(values=hot) | |
| p=p + theme_bw() | |
| p=p+theme(plot.title = element_text(hjust = 0.5)) | |
| p=p+facet_wrap( ~ month, ncol=2) | |
| ggsave("Months.png", width = 30, height = 35, units = "cm") | |
| p | |
This file contains bidirectional Unicode text that may be interpreted or compiled differently than what appears below. To review, open the file in an editor that reveals hidden Unicode characters.
Learn more about bidirectional Unicode characters
| library("cowplot") | |
| figure<-ggdraw() + | |
| draw_plot(junp, x = 0, y = .5, width = 1, height = .5) + | |
| draw_plot(julp, x = 0, y = 0, width = .5, height = .5) + | |
| draw_plot(sepp, x = 0.5, y = 0.0, width = .5, height = 0.5) #+ | |
| #draw_plot_label(label = c("A", "B", "C"), size = 15, x = c(0, 0.5, 0), y = c(1, 1, 0.5)) | |
| annotate_figure(figure, | |
| top = text_grob("Summer Temperatures England since 1878", color = "Black", face = "bold", size = 16), | |
| bottom = text_grob("data: hadcet from metoffice.gov.uk", color = "blue", | |
| hjust = 1, x = 1, face = "italic", size = 10) | |
| #left = text_grob("Figure arranged using ggpubr", color = "green", rot = 90), | |
| #right = "I'm done, thanks :-)!", | |
| #fig.lab = "Figure 1", fig.lab.face = "bold" | |
| ) | |
| ggsave("summerEng.png") |

Sign up for free
to join this conversation on GitHub.
Already have an account?
Sign in to comment