Created
February 28, 2019 08:46
-
-
Save fbraem/897e97b84f181af83229692e08bd367c to your computer and use it in GitHub Desktop.
MQ Clusterdiagram using MQWeb and vis.js
This file contains bidirectional Unicode text that may be interpreted or compiled differently than what appears below. To review, open the file in an editor that reveals hidden Unicode characters.
Learn more about bidirectional Unicode characters
| <html> | |
| <head> | |
| <link rel="stylesheet" href="/node_modules/vis/dist/vis.min.css"></link> | |
| <script type="text/javascript" src="/node_modules/vis/dist/vis.min.js"></script> | |
| <script type="text/javascript" src="/node_modules/axios/dist/axios.min.js"></script> | |
| <title>CLuster View</title> | |
| </head> | |
| <body> | |
| <h1>Cluster View</h1> | |
| <div id="clusterView"></div> | |
| <script type="text/javascript"> | |
| axios.post('http://localhost:8081/api/clusqmgr/inquire/PIGEON') | |
| .then(function(response) { | |
| var dotStr = "dinetwork { "; | |
| for(var e in response.data.data) { | |
| var data = response.data.data[e]; | |
| dotStr += data.QMgrName.value + " -> " + data.ClusterName.value + ";"; | |
| }; | |
| dotStr += " }"; | |
| var container = document.getElementById('clusterView'); | |
| var parsed = vis.network.convertDot(dotStr); | |
| var networkData = { | |
| nodes: parsed.nodes, | |
| edges: parsed.edges | |
| }; | |
| var network = new vis.Network(container, networkData, {}); | |
| }); | |
| </script> | |
| </body> | |
| </html> |
Sign up for free
to join this conversation on GitHub.
Already have an account?
Sign in to comment
Used MQWeb, axios and vis.js. To create a quick prototype I used DOT graph description language.
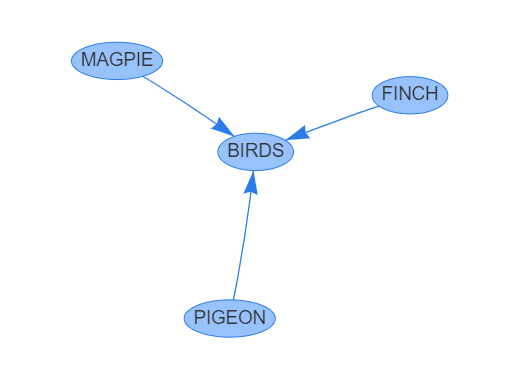
On our test environment this results in the following diagram: