You signed in with another tab or window. Reload to refresh your session.You signed out in another tab or window. Reload to refresh your session.You switched accounts on another tab or window. Reload to refresh your session.Dismiss alert
Login to your worker node: (oc debug or direct ssh)
$ oc debug node/<worker-node>
Get Host Access
$ chroot /host
Lets see how service and nodeport definitions are looking on this worker
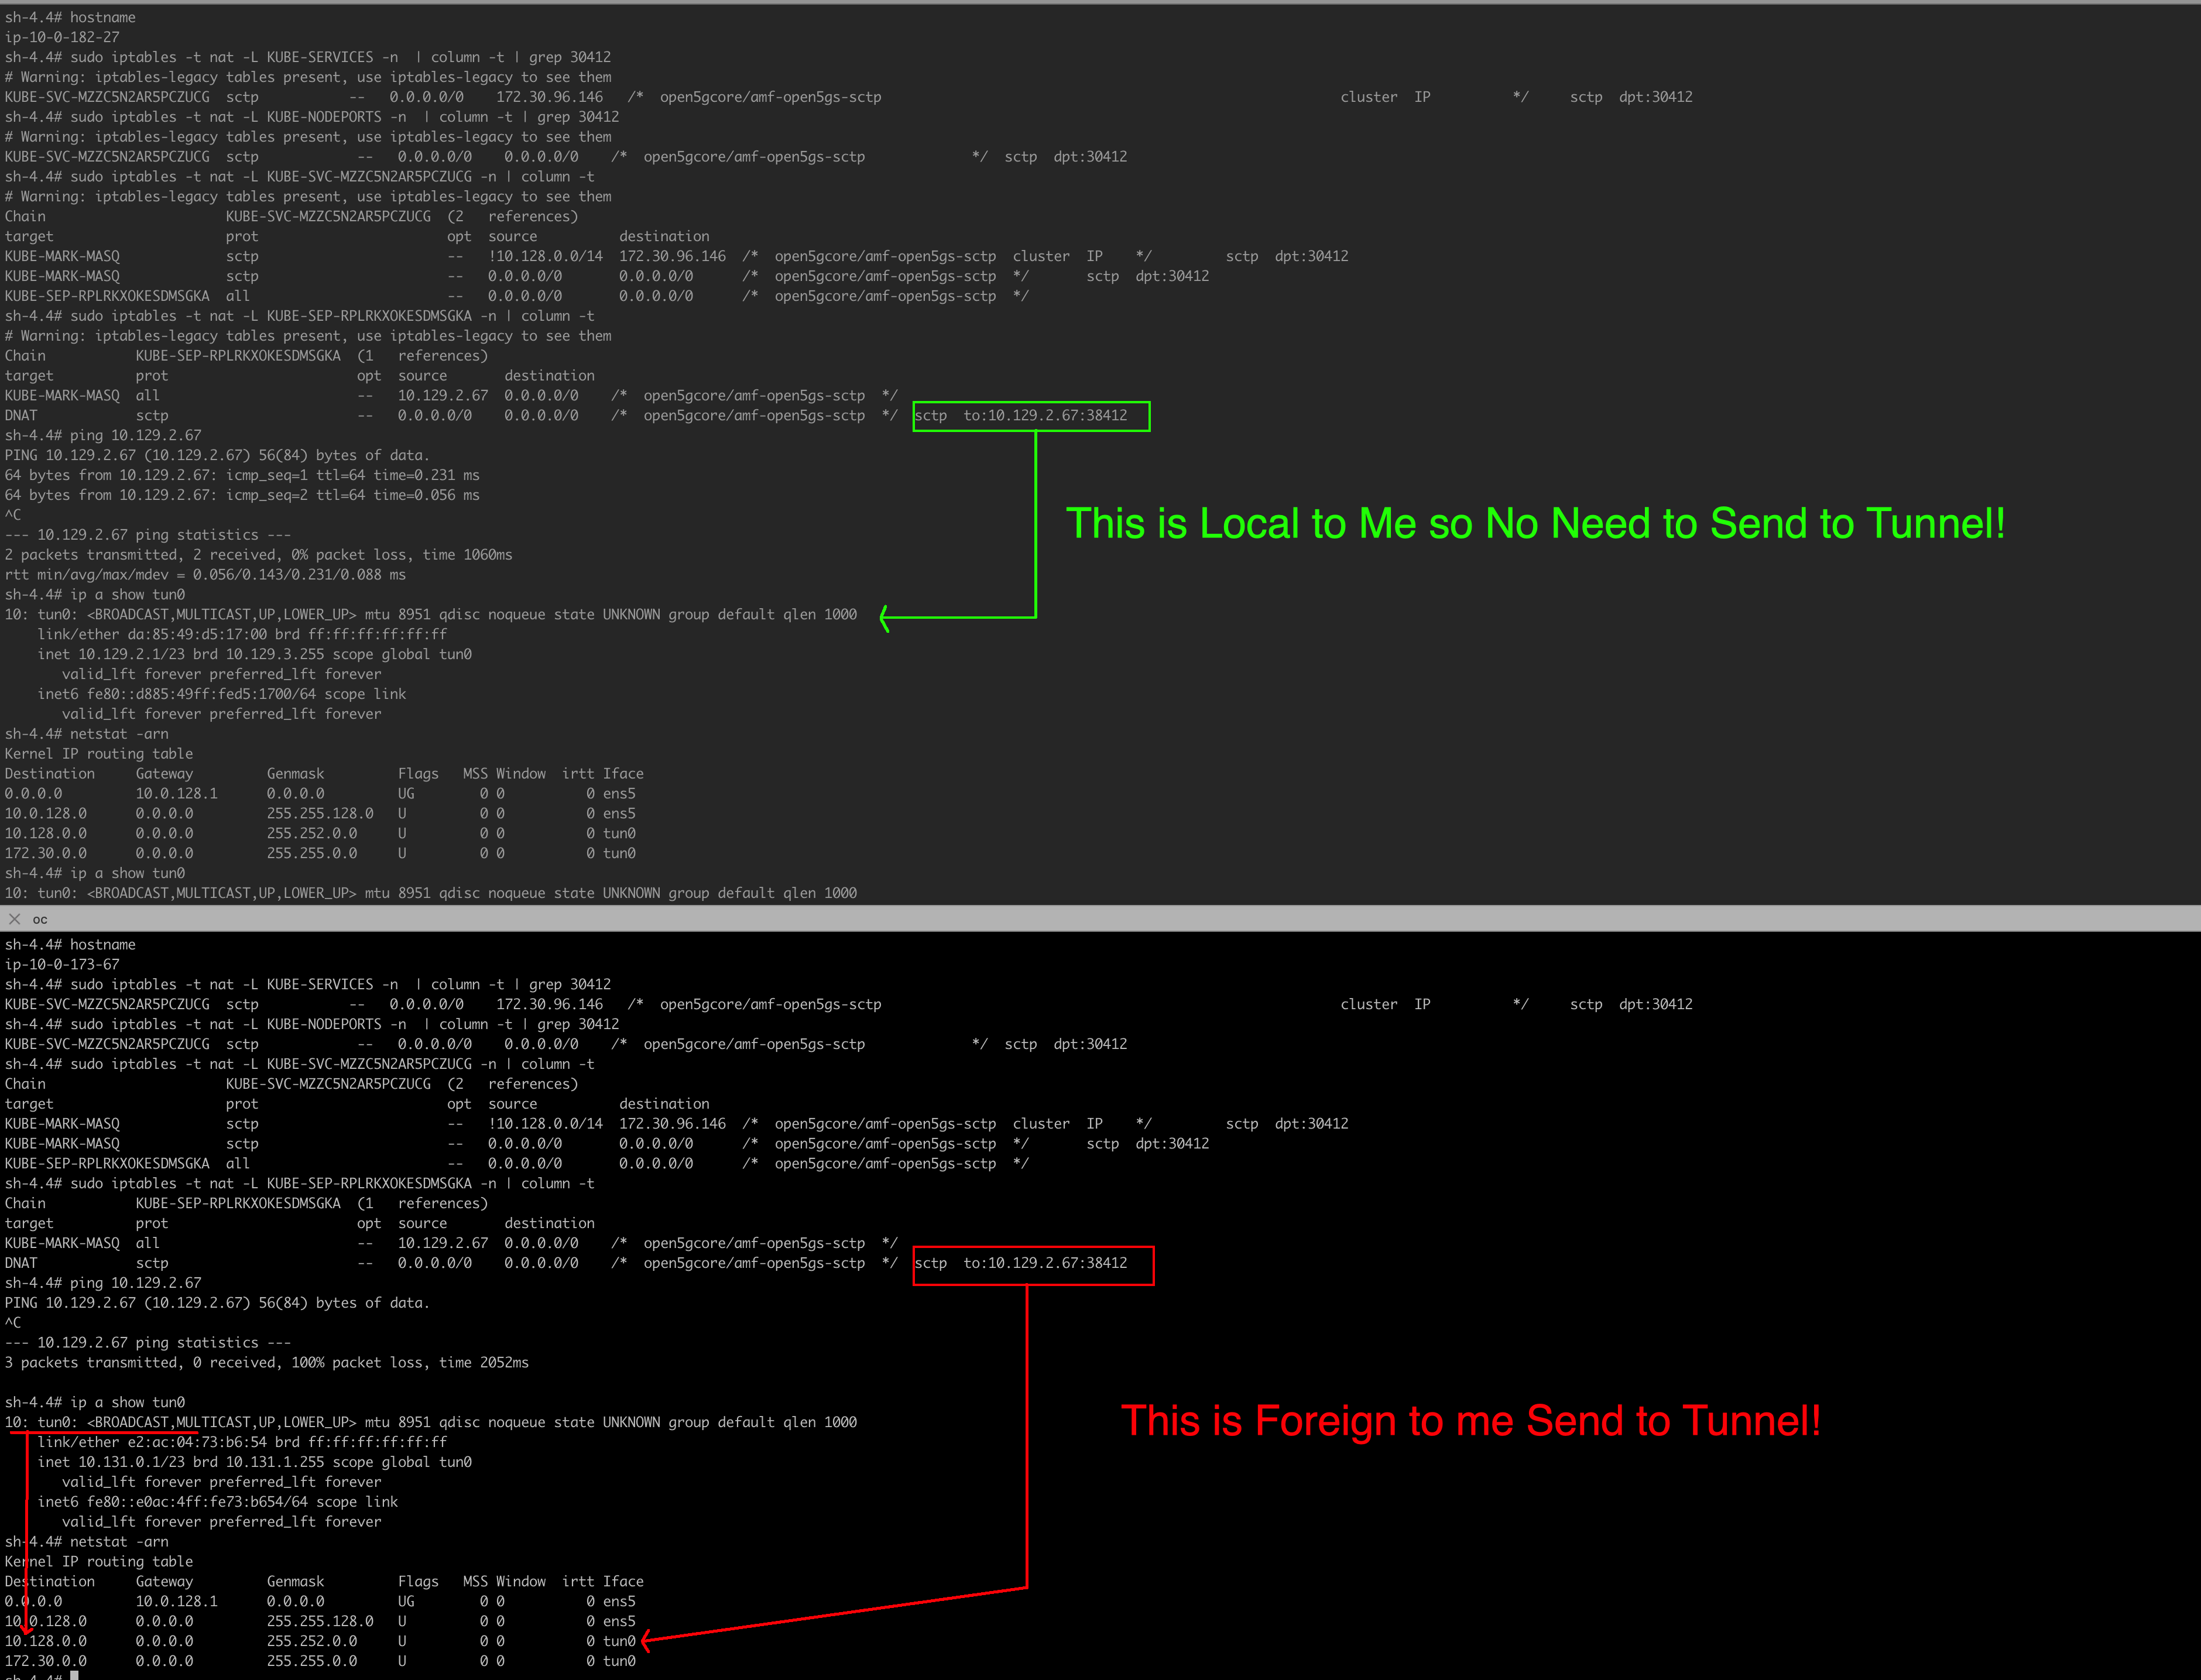
# iptables -t nat -L KUBE-SERVICES -n | column -t | grep <yourexposedsvcportnumber>
 <see your service listed here, something like KUBE-SVC-FENARX>
# iptables -t nat -L KUBE-NODEPORTS -n | column -t | grep <yourexposedsvcportnumber>
 <see your nodeport service listed here, something like KUBE-SVC-FENARX that matches above resource-id>
# iptables -t nat -L <your svc id: KUBE-SVC-FENARX> -n | column -t
 <you will see KUBE-MARK-XXXX and KUBE-SEP-FENARXXX listed undr target/protocol/source/destionation table columns>
# iptables -t nat -L <your KUBE-SEP id: KUBE-SEP-FENARXXX> -n | column -t
 < you will see KUBE-MAR-XXX and DNAT listed for your nodeport ingress and routing with protocol tag followed by to:address:port
On the same worker try to ping the service node-ip to see if traffic routed over tun0 interface of the node towards the node that hosts the application pods.