-
-
Save hkmoon/aa4041d59f297560e1a65ac2ee124c72 to your computer and use it in GitHub Desktop.
Hi @TheUser2021,
Thanks for the comments and questions!
There are two ways of achieving what you'd like to do.
- Use
from IPython.display import Javascriptin your python kernel.
from IPython.display import Javascript
import json

data = [{
        "country": "Lithuania",
        "litres": 501.9
    }, {
        "country": "Czech Republic",
        "litres": 301.9
    }, {
        "country": "Ireland",
        "litres": 201.1
    }, {
        "country": "Germany",
        "litres": 165.8
    }, {
        "country": "Australia",
        "litres": 139.9
    }, {
        "country": "Austria",
        "litres": 128.3
    }, {
        "country": "UK",
        "litres": 99
    }, {
        "country": "Belgium",
        "litres": 60
    }, {
        "country": "The Netherlands",
        "litres": 50
}]Javascript("""
require.config({
paths: {
d3: '//cdnjs.cloudflare.com/ajax/libs/d3/5.15.0/d3.min',
amchart_core: '//www.amcharts.com/lib/4/core',
amchart_charts: '//www.amcharts.com/lib/4/charts',
'amcharts4/themes/animated': '//www.amcharts.com/lib/4/themes/animated',
},
shim: {
amchart_core: {
init: function () {
return window.am4core;
}
},
amchart_charts: {
deps: ['amchart_core'],
exports: 'amchart_charts',
init: function () {
return window.am4charts;
}
},
'amcharts4/themes/animated': {
deps: ['amchart_core'],
init: function () {
return window.am4themes_animated;
}
}
}
});
element.append('<div id="chartdiv" style="height: 500px;"></div>');
require(['amchart_core', 'amchart_charts', 'amcharts4/themes/animated'], function (am4core, am4charts, am4themes_animated) {
am4core.useTheme(am4themes_animated);
// Create chart instance
var chart = am4core.create("chartdiv", am4charts.PieChart);
// Add data
chart.data = %s;
// Add and configure Series
var pieSeries = chart.series.push(new am4charts.PieSeries());
pieSeries.dataFields.value = "litres";
pieSeries.dataFields.category = "country";
// Add export
chart.exporting.menu = new am4core.ExportMenu();
}, function (err) {
console.log(err);
});
""" % json.dumps(data))- Communication through a file
# Import pandas library
import pandas as pd

# Create the pandas DataFrame
df = pd.DataFrame(data, columns = ['country', 'litres'])

#Save df as json
df.to_json(r'df.json', orient="records")
We added d3 in the require function for reading the json file.
%%javascript

require.config({
  paths: {
     d3: '//cdnjs.cloudflare.com/ajax/libs/d3/5.15.0/d3.min',
     amchart_core: '//www.amcharts.com/lib/4/core',
     amchart_charts: '//www.amcharts.com/lib/4/charts',
     'amcharts4/themes/animated': '//www.amcharts.com/lib/4/themes/animated',
  },
  shim: {
     amchart_core: {
          init: function () {
              return window.am4core;
          }
      },
      amchart_charts: {
          deps: ['amchart_core'],
          exports: 'amchart_charts',
          init: function () {
              return window.am4charts;
          }
      },
      'amcharts4/themes/animated': {
          deps: ['amchart_core'],
          init: function () {
              return window.am4themes_animated;
          }
      }
  }
});

element.append('<div id="chartdiv-1" style="height: 500px;"></div>');

(function(element) {
require(['amchart_core', 'amchart_charts', 'amcharts4/themes/animated', 'd3'], function (am4core, am4charts, am4themes_animated, d3) {
    d3.json("df.json").then(function(json){
            am4core.useTheme(am4themes_animated);

            // Create chart instance
            var chart = am4core.create("chartdiv-1", am4charts.PieChart);

            // Add data
            chart.data = json;

            // Add and configure Series
            var pieSeries = chart.series.push(new am4charts.PieSeries());
            pieSeries.dataFields.value = "litres";
            pieSeries.dataFields.category = "country";

            // Add export
            chart.exporting.menu = new am4core.ExportMenu();
        }, function (err) {
            console.log(err);
        });
    });
})(element);
I checked two methods are working. You can choose one of them. I'd prefer the file communication if you are dealing with large dataset.
BTW, you can copy each code block and paste it in the cell of jupyter notebook.
Have fun!
Thanks so much for getting back to me! Appreciated! Not many people do this. :-)
I think I almost have it, but for some reason my graph is not yet displayed when I use option 2 in the following build-up of cells. (browser log: Chart was not Disposed id-xxxx)
I am using a different graph type and source data. I know that the code for the rest of the graph is ok, as it works fine when I manually put in some data in the code. This is the work flow:
[in]
IMPORT DATA
import pandas as pd
data = pd.read_csv("file.csv", parse_dates=[0])
data.head()
[out]
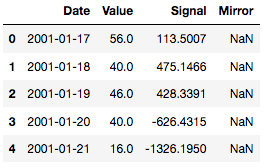
[in]
Import pandas library
import pandas as pd
Create the pandas DataFrame
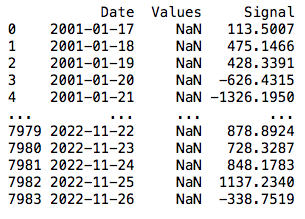
df = pd.DataFrame(data, columns = ['Date', 'Values', 'Signal'])
#Save df as json
json = df.to_json(r'df.json', orient="records")
print(df)
[out]
[in]
`%%javascript
require.config({
paths: {
d3: '//cdnjs.cloudflare.com/ajax/libs/d3/5.15.0/d3.min',
amchart_core: '//www.amcharts.com/lib/4/core',
amchart_charts: '//www.amcharts.com/lib/4/charts',
'amcharts4/themes/animated': '//www.amcharts.com/lib/4/themes/animated',
},
shim: {
amchart_core: {
init: function () {
return window.am4core;
}
},
amchart_charts: {
deps: ['amchart_core'],
exports: 'amchart_charts',
init: function () {
return window.am4charts;
}
},
'amcharts4/themes/animated': {
deps: ['amchart_core'],
init: function () {
return window.am4themes_animated;
}
}
}
});
element.append('
');(function(element) {
require(['amchart_core', 'amchart_charts', 'amcharts4/themes/animated', 'd3'], function (am4core, am4charts, am4themes_animated, d3) {
d3.json("df.json").then(function(json){
am4core.useTheme(am4themes_animated);
        // Create chart instance
        var chart = am4core.create("chartdiv", am4charts.XYChart);

        // Add data
        chart.data = json;

        // Create Graph Title
        var title = chart.titles.create();
        title.text = "Title";
        title.fontSize = 25;
        title.fill = am4core.color("#000000");
        // note that marginBottom was removed
        //title.marginBottom = 5;
        title.align = "left";
        // Place it in plotContainer so we can align it according to the graph
        title.parent = chart.plotContainer;
        title.isMeasured = false; // Take it out of the flow of the container
        title.toBack();
        title.verticalCenter = "top";
        //title.y = 0;
        //title.dy = -5;

        // create date axis
        var dateAxis = chart.xAxes.push(new am4charts.DateAxis());
        dateAxis.dataFields.category = "Date";
        dateAxis.renderer.grid.template.location = 0.5;
        dateAxis.dateFormatter.inputDateFormat = "yyyy-MM-dd";
        dateAxis.renderer.minGridDistance = 40;
        dateAxis.tooltipDateFormat = "MMM dd, yyyy";
        dateAxis.dateFormats.setKey("day", "dd");
        dateAxis.renderer.grid.template.disabled = true;

        // Create series 1 + axis
        var valueAxis = chart.yAxes.push(new am4charts.ValueAxis());
        valueAxis.renderer.grid.template.disabled = true;
        valueAxis.renderer.labels.template.fill = am4core.color("#0000000");

        var series = chart.series.push(new am4charts.LineSeries());
        series.dataFields.valueY = "Value";
        series.dataFields.dateX = "Date";
        series.strokeWidth = 4;
        series.stroke = am4core.color("#000000");
        series.fill = am4core.color("#000000");
        series.name = "Real time";
        series.tooltipText = "{name}: [bold]{valueY}[/]";
        series.tensionX = 0.8;

        series.filters.push(new am4core.DropShadowFilter());


        // create series 2 + axis
        var valueAxis2 = chart.yAxes.push(new am4charts.ValueAxis());
        valueAxis2.renderer.opposite = true;
        valueAxis2.renderer.grid.template.disabled = true;
        valueAxis2.renderer.labels.template.disabled = true;
        valueAxis2.cursorTooltipEnabled = false;

        var series2 = chart.series.push(new am4charts.LineSeries());
        series2.dataFields.valueY = "Signal";
        series2.dataFields.dateX = "Date";
        series2.stroke = am4core.color("#ff002a");
        series2.fill = am4core.color("#ff002a");
        series2.name = "Signal 2";
        series2.strokeDasharray = 3;
        series2.strokeWidth = 4;
        series2.strokeOpacity = 1;
        series2.strokeDasharray = "3,3";
        series2.tooltipText = "{name}[/]";
        series2.tensionX = 0.8;

        series2.filters.push(new am4core.DropShadowFilter());

        // important
        series2.yAxis = valueAxis2;

        // Graph Background Colors
        chart.plotContainer.background.fill = am4core.color("#F5F5F5");
        chart.plotContainer.background.fillOpacity = 1;

        // Scroll Bar
        chart.scrollbarX = new am4core.Scrollbar();
        chart.scrollbarX.parent = chart.bottomAxesContainer;

        // Add legend
        chart.legend = new am4charts.Legend();

        // Add cursor
        chart.cursor = new am4charts.XYCursor();

        // Enable export
        chart.exporting.menu = new am4core.ExportMenu();
        chart.exporting.menu.align = "right";
        chart.exporting.menu.verticalAlign = "top";

        chart.exporting.menu.items = [{
            "label": "...",
            "menu": [
                { "type": "png", "label": "Save as PNG Image" },
                { "label": "Print", "type": "Print" }
            ]
        }];

        // Copyright Label
        var watermark = new am4core.Label();
        watermark.text = "#";
        chart.plotContainer.children.push(watermark);
        watermark.align = "right";
        watermark.valign = "bottom";
        watermark.fontSize = 12;
        watermark.opacity = 0.2;
        watermark.marginRight = 10;
        watermark.marginBottom = 5;
        watermark.url = "https://#";
        watermark.urlTarget = "_blank";

        // Watermark Logo
        var watermark2 = new am4core.Image();
        watermark2.href = "https://#";
        chart.plotContainer.children.push(watermark2);
        watermark2.align = "center";
        watermark2.valign = "middle";
        watermark2.opacity = 0.2;
        watermark2.marginRight = 10;
        watermark2.marginBottom = 5;

        // set width/height AND/OR scale
        watermark2.scale = 1;
        watermark2.width = 400;
        watermark2.height = 400;

    }, function (err) {
        console.log(err);
    });
});
})(element);`
[out]
(no graph is displayed)
Maybe df = pd.DataFrame(data, columns = ['Date', 'Values', 'Signal']) should be df = pd.DataFrame(data, columns = ['Date', 'Value', 'Signal'])?
Could you check the json file is well formatted as you expected too?
Hi, Yes, the Values was a stupid mismatch.. :-) However their is still something not happy in my code and I cant figure out what it is as their is no clear error given in the notebook log. Wondering, could I send you the notebook and csv file to have a quick look?
Have a nice weekend.
Can you try my code instead? It shows XYChart as you expected. ;)
import json

data = [{
        "Date": "2001-01-17",
        "Value": 56,
        "Signal": 113.5007
    }, {
        "Date": "2001-01-18",
        "Value": 40,
        "Signal": 457
    }, {
        "Date": "2001-01-19",
        "Value": 46,
        "Signal": 428
    }]
# Import pandas library
import pandas as pd

# Create the pandas DataFrame
df = pd.DataFrame(data, columns = ['Date','Value', 'Signal'])

#Save df as json
df.to_json(r'df.json', orient="records")%%javascript
require.config({
paths: {
d3: '//cdnjs.cloudflare.com/ajax/libs/d3/5.15.0/d3.min',
amchart_core: '//www.amcharts.com/lib/4/core',
amchart_charts: '//www.amcharts.com/lib/4/charts',
'amcharts4/themes/animated': '//www.amcharts.com/lib/4/themes/animated',
},
shim: {
amchart_core: {
init: function () {
return window.am4core;
}
},
amchart_charts: {
deps: ['amchart_core'],
exports: 'amchart_charts',
init: function () {
return window.am4charts;
}
},
'amcharts4/themes/animated': {
deps: ['amchart_core'],
init: function () {
return window.am4themes_animated;
}
}
}
});
element.append('<div id="chartdiv" style="height: 500px;"></div>');
(function(element) {
require(['amchart_core', 'amchart_charts', 'amcharts4/themes/animated', 'd3'], function (am4core, am4charts, am4themes_animated, d3) {
d3.json("df.json").then(function(json){
am4core.useTheme(am4themes_animated);
// Create chart instance
var chart = am4core.create("chartdiv", am4charts.XYChart);
// Add data
chart.data = json;
// Create Graph Title
var title = chart.titles.create();
title.text = "Title";
title.fontSize = 25;
title.fill = am4core.color("#000000");
// note that marginBottom was removed
//title.marginBottom = 5;
title.align = "left";
// Place it in plotContainer so we can align it according to the graph
title.parent = chart.plotContainer;
title.isMeasured = false; // Take it out of the flow of the container
title.toBack();
title.verticalCenter = "top";
//title.y = 0;
//title.dy = -5;
// create date axis
var dateAxis = chart.xAxes.push(new am4charts.DateAxis());
dateAxis.dataFields.category = "Date";
dateAxis.renderer.grid.template.location = 0.5;
dateAxis.dateFormatter.inputDateFormat = "yyyy-MM-dd";
dateAxis.renderer.minGridDistance = 40;
dateAxis.tooltipDateFormat = "MMM dd, yyyy";
dateAxis.dateFormats.setKey("day", "dd");
dateAxis.renderer.grid.template.disabled = true;
// Create series 1 + axis
var valueAxis = chart.yAxes.push(new am4charts.ValueAxis());
valueAxis.renderer.grid.template.disabled = true;
valueAxis.renderer.labels.template.fill = am4core.color("#0000000");
var series = chart.series.push(new am4charts.LineSeries());
series.dataFields.valueY = "Value";
series.dataFields.dateX = "Date";
series.strokeWidth = 4;
series.stroke = am4core.color("#000000");
series.fill = am4core.color("#000000");
series.name = "Real time";
series.tooltipText = "{name}: [bold]{valueY}[/]";
series.tensionX = 0.8;
series.filters.push(new am4core.DropShadowFilter());
// create series 2 + axis
var valueAxis2 = chart.yAxes.push(new am4charts.ValueAxis());
valueAxis2.renderer.opposite = true;
valueAxis2.renderer.grid.template.disabled = true;
valueAxis2.renderer.labels.template.disabled = true;
valueAxis2.cursorTooltipEnabled = false;
var series2 = chart.series.push(new am4charts.LineSeries());
series2.dataFields.valueY = "Signal";
series2.dataFields.dateX = "Date";
series2.stroke = am4core.color("#ff002a");
series2.fill = am4core.color("#ff002a");
series2.name = "Signal 2";
series2.strokeDasharray = 3;
series2.strokeWidth = 4;
series2.strokeOpacity = 1;
series2.strokeDasharray = "3,3";
series2.tooltipText = "{name}[/]";
series2.tensionX = 0.8;
series2.filters.push(new am4core.DropShadowFilter());
// important
series2.yAxis = valueAxis2;
// Graph Background Colors
chart.plotContainer.background.fill = am4core.color("#F5F5F5");
chart.plotContainer.background.fillOpacity = 1;
// Scroll Bar
chart.scrollbarX = new am4core.Scrollbar();
chart.scrollbarX.parent = chart.bottomAxesContainer;
// Add legend
chart.legend = new am4charts.Legend();
// Add cursor
chart.cursor = new am4charts.XYCursor();
// Enable export
chart.exporting.menu = new am4core.ExportMenu();
chart.exporting.menu.align = "right";
chart.exporting.menu.verticalAlign = "top";
chart.exporting.menu.items = [{
"label": "...",
"menu": [
{ "type": "png", "label": "Save as PNG Image" },
{ "label": "Print", "type": "Print" }
]
}];
// Copyright Label
var watermark = new am4core.Label();
watermark.text = "#";
chart.plotContainer.children.push(watermark);
watermark.align = "right";
watermark.valign = "bottom";
watermark.fontSize = 12;
watermark.opacity = 0.2;
watermark.marginRight = 10;
watermark.marginBottom = 5;
watermark.url = "https://#";
watermark.urlTarget = "_blank";
// Watermark Logo
var watermark2 = new am4core.Image();
watermark2.href = "https://#";
chart.plotContainer.children.push(watermark2);
watermark2.align = "center";
watermark2.valign = "middle";
watermark2.opacity = 0.2;
watermark2.marginRight = 10;
watermark2.marginBottom = 5;
// set width/height AND/OR scale
watermark2.scale = 1;
watermark2.width = 400;
watermark2.height = 400;
}, function (err) {
console.log(err);
});
});
})(element);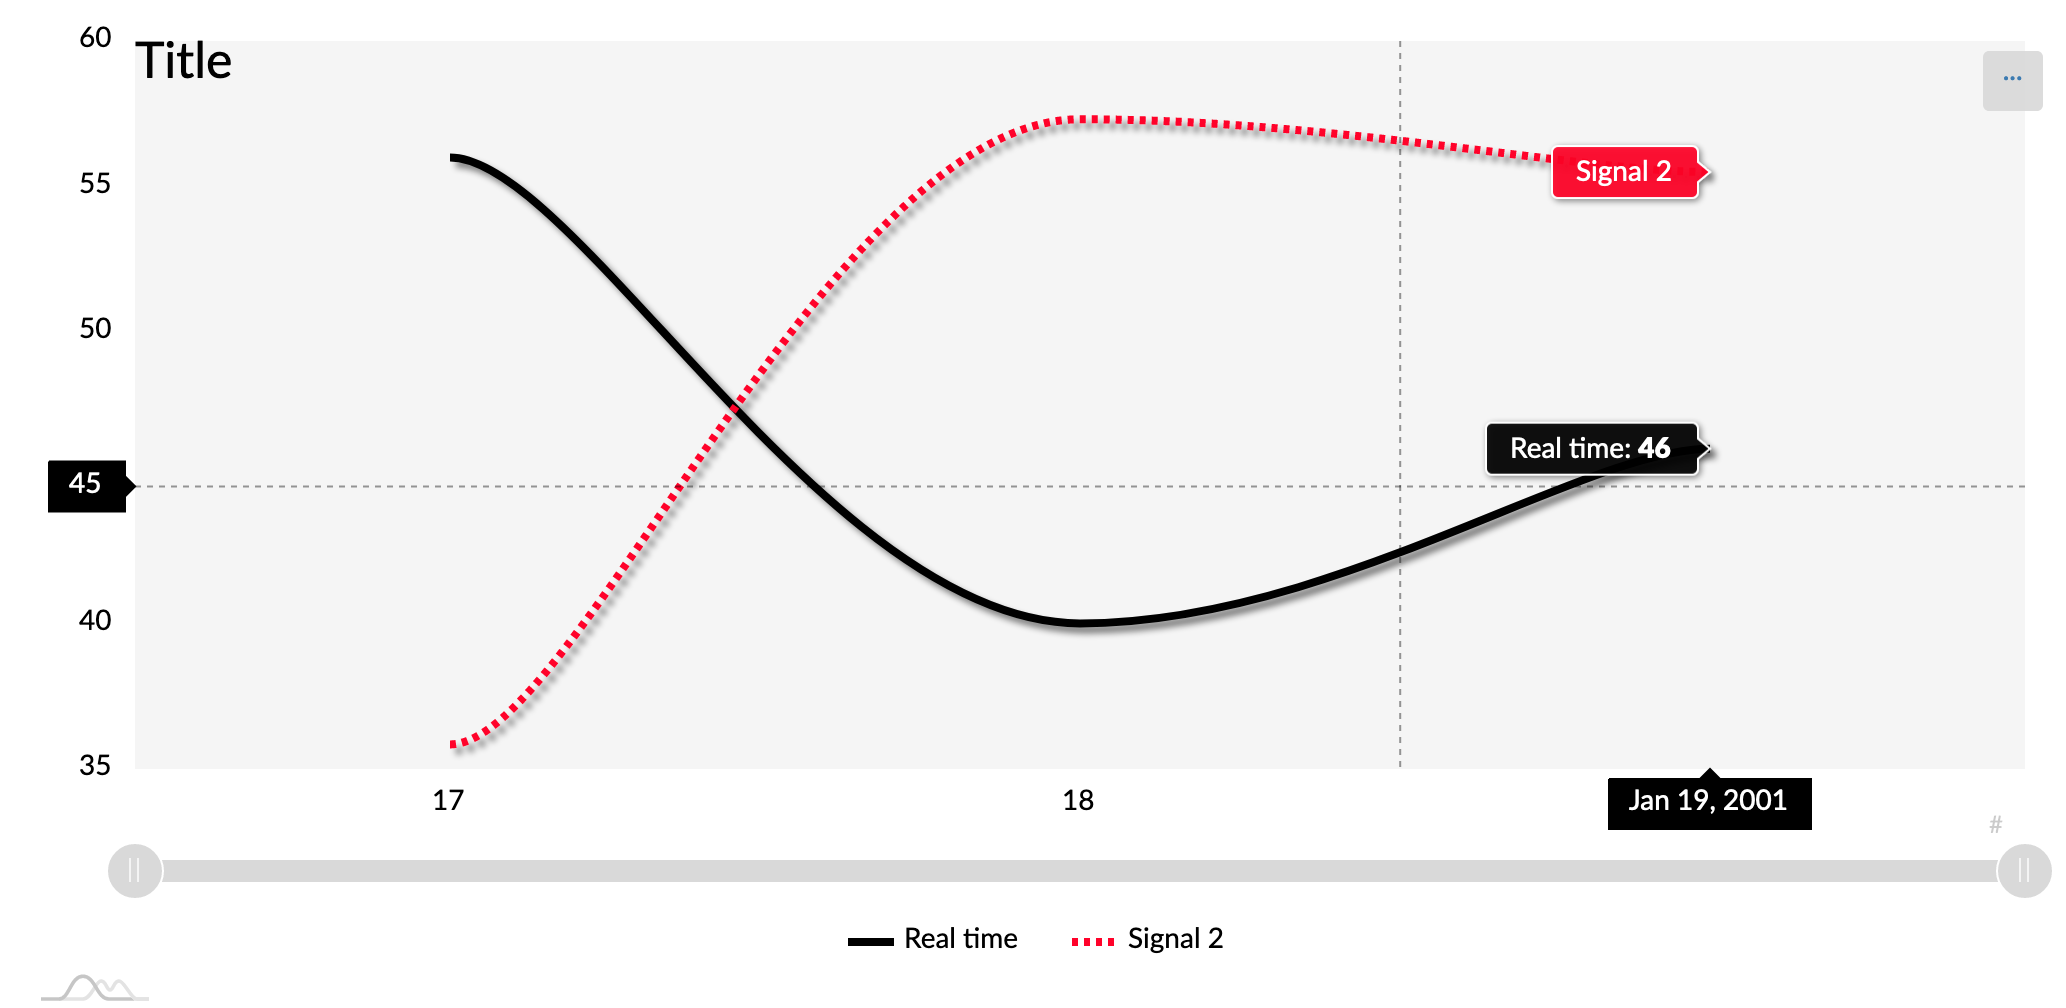
Thanks for helping out.
Very strange. I copy all you supplied in the two cells, and nothing is happening. I am only getting the error: "Chart was not disposed id-1545"
Looking at the message, it looks like something is still in memory. I will have a closer look. I am sure it will work after as you are displaying a great looking graph. :-)
I let you know what I find and post it here for anyone else if they need it. Thanks again!! And have a nice weekend.
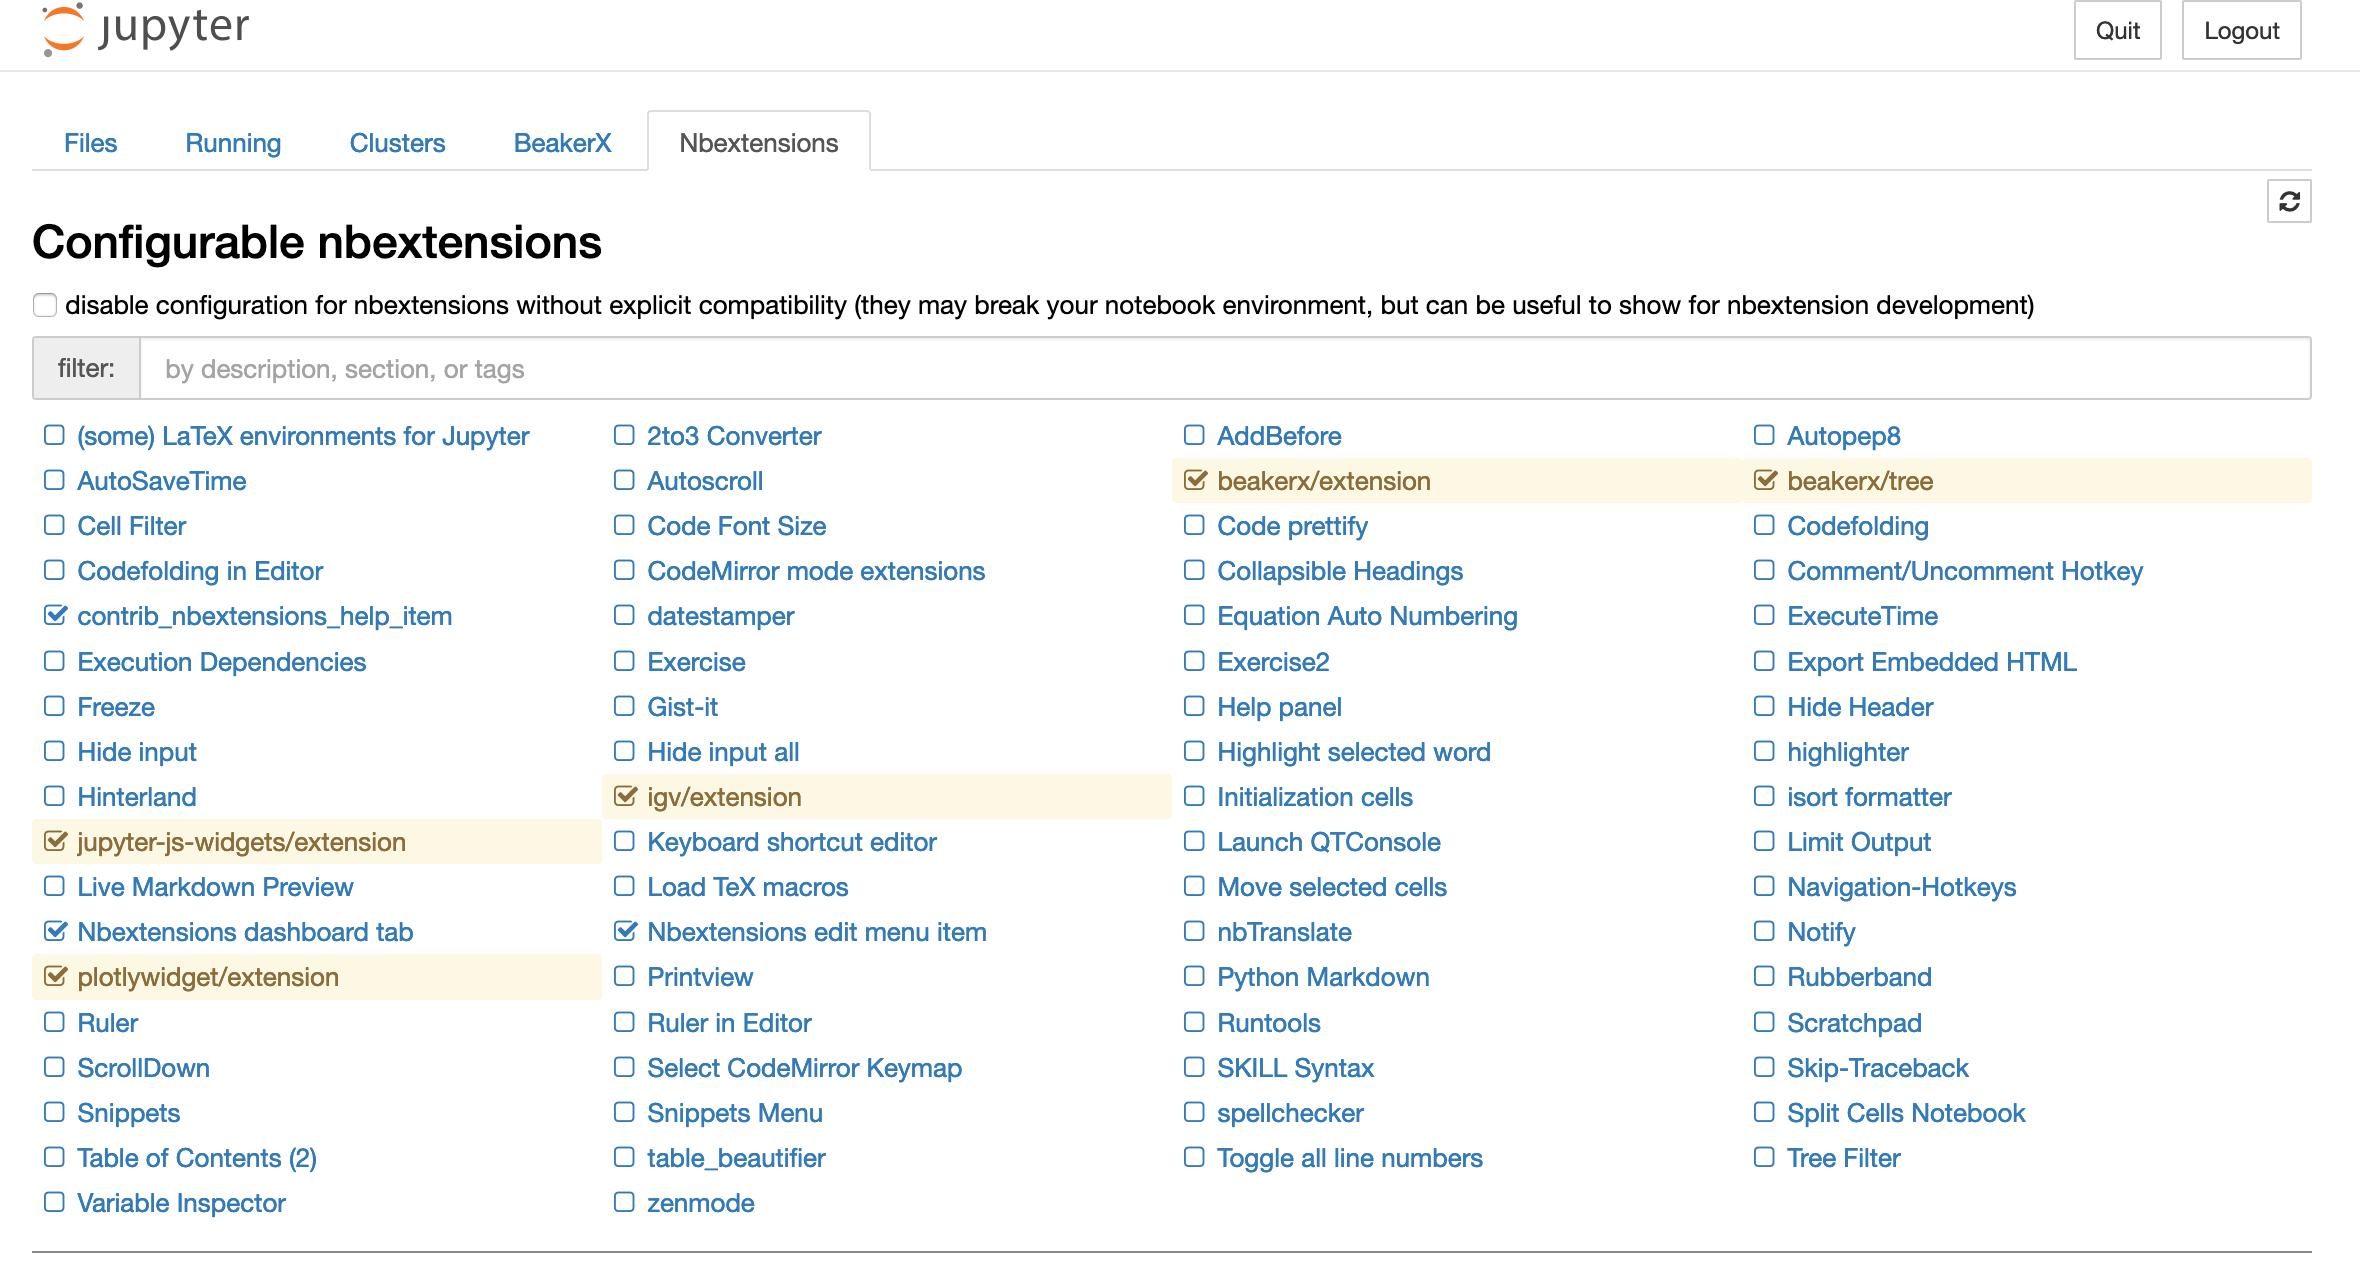
Just FYI, I avoid using JupyterLab because it has some security check modules preventing from using HTML direct access.
I still prefer using BeakerX (http://beakerx.com/) with classic Jupyter which supports Java as well. Sometimes, I use it to change programming contexts.
Here are my nbextensions. Hopefully, it will help you to find the issues. Have a nice weekend too!
Thanks for the tip! I will have a look at this as well.
Hi, @hkmoon Great work. Actully I was working with code provided by you in version 5 in notebook. But I am not getting the amchart. Could help me in this? thanks.
Hi, @ArsalanAli915 Please, make sure you are using https protocol in your jupyter endpoint since amcharts do not support http protocol. Otherwise, you can add https: in front of amcharts' urls. However, I am not sure how your browser likes it.
@hkmoon thanks for replying here is my code.
from IPython.display import Javascript, HTML
import json
import base64
from fpdf import FPDF
from io import BytesIO
data1 = [{
"country": "Lithuania",
"litres": 501.9
}, {
"country": "Czech Republic",
"litres": 301.9
}, {
"country": "Ireland",
"litres": 201.1
}, {
"country": "Germany",
"litres": 165.8
}, {
"country": "Australia",
"litres": 139.9
}, {
"country": "Austria",
"litres": 128.3
}, {
"country": "UK",
"litres": 99
}, {
"country": "Belgium",
"litres": 60
}, {
"country": "The Netherlands",
"litres": 50
}]
Javascript("""
require.config({
paths: {
d3: '//cdnjs.cloudflare.com/ajax/libs/d3/5.15.0/d3.min',
amchart_core: '//www.amcharts.com/lib/4/core',
amchart_charts: '//www.amcharts.com/lib/4/charts',
'amcharts4/themes/animated': '//www.amcharts.com/lib/4/themes/animated',
},
shim: {
amchart_core: {
init: function () {
return window.am4core;
}
},
amchart_charts: {
deps: ['amchart_core'],
exports: 'amchart_charts',
init: function () {
return window.am4charts;
}
},
'amcharts4/themes/animated': {
deps: ['amchart_core'],
init: function () {
return window.am4themes_animated;
}
}
}
});
element.append('
');require(['amchart_core', 'amchart_charts', 'amcharts4/themes/animated'], function (am4core, am4charts, am4themes_animated) {
am4core.useTheme(am4themes_animated);
 // Create chart instance
var chart = am4core.create("chartdiv", am4charts.PieChart);

// Add data
chart.data = %s;

// Add and configure Series
var pieSeries = chart.series.push(new am4charts.PieSeries());
pieSeries.dataFields.value = "litres";
pieSeries.dataFields.category = "country";

// Add export
chart.exporting.menu = new am4core.ExportMenu();
}, function (err) {
console.log(err);
});
""" % json.dumps(data))
could help me to do it in version 5 of amchart.
@hkmoon This above code works for version 4 but I need it in version 5.
%%javascript

require.config({
  paths: {
     d3: '//cdnjs.cloudflare.com/ajax/libs/d3/5.15.0/d3.min',
     am5: '//www.amcharts.com/lib/5/index',
     am5xy: '//www.amcharts.com/lib/5/xy',
     'am5themes_Animated': '//www.amcharts.com/lib/5/themes/Animated',
  },
  shim: {
     am5: {
          init: function () {
              return am5;
          }
      },
      am5xy: {
          deps: ['am5'],
          exports: 'am5xy',
          init: function () {
              return am5xy;
          }
      },
      'am5themes_Animated': {
          deps: ['am5'],
          init: function () {
              return am5themes_Animated;
          }
      }
  }
});

element.append('<div id="chartdiv" style="height: 500px;"></div>');

require(['am5', 'am5xy', 'am5themes_Animated'], function (am5, am5xy, am5themes_Animated) {
    var root = am5.Root.new("chartdiv");

    root.setThemes([
      am5themes_Animated.new(root)
    ]);

    var chart = root.container.children.push(
      am5xy.XYChart.new(root, {
        panY: false,
        wheelY: "zoomX",
        layout: root.verticalLayout
      })
    );

    // Define data
    var data = [{
      category: "Research",
      value1: 1000,
      value2: 588
    }, {
      category: "Marketing",
      value1: 1200,
      value2: 1800
    }, {
      category: "Sales",
      value1: 850,
      value2: 1230
    }];

    // Craete Y-axis
    let yAxis = chart.yAxes.push(
      am5xy.ValueAxis.new(root, {
        renderer: am5xy.AxisRendererY.new(root, {
        })
      })
    );

    // Create X-Axis
    var xAxis = chart.xAxes.push(
      am5xy.CategoryAxis.new(root, {
          maxDeviation: 0.2,
          renderer: am5xy.AxisRendererX.new(root, {
        }),
        categoryField: "category"
      })
    );
    xAxis.data.setAll(data);

    // Create series
    var series1 = chart.series.push(
      am5xy.ColumnSeries.new(root, {
        name: "Series",
        xAxis: xAxis,
        yAxis: yAxis,
        valueYField: "value1",
        categoryXField: "category",
        tooltip: am5.Tooltip.new(root, {})
      })
    );
    series1.data.setAll(data);

    var series2 = chart.series.push(
      am5xy.ColumnSeries.new(root, {
        name: "Series",
        xAxis: xAxis,
        yAxis: yAxis,
        valueYField: "value2",
        categoryXField: "category"
      })
    );
    series2.data.setAll(data);

    // Add legend
    var legend = chart.children.push(am5.Legend.new(root, {}));
    legend.data.setAll(chart.series.values);
}, function (err) {
    console.log(err);
});@hkmoon for helping me out. Sorry, my bad image took some time to display. thanks for helping out. Is there any way to convert exported data into and then png into pdf? would be a great help. thanks.
@hkmoon I really appriciate the time u have given. Actually using link I have tried export my pie chart genreated by this code
%%javascript
require.config({
paths: {
d3: '//cdnjs.cloudflare.com/ajax/libs/d3/5.15.0/d3.min',
am5: '//www.amcharts.com/lib/5/index',
am5percent: '//www.amcharts.com/lib/5/percent',
exporting: '//www.amcharts.com/lib/5/plugins/exporting',
'am5themes_Animated': '//www.amcharts.com/lib/5/themes/Animated',
},
shim: {
am5: {
init: function () {
return am5;
}
},
am5percent: {
deps: ['am5'],
exports: 'am5xy',
init: function () {
return am5percent;
}
},
exporting: {
deps: ['am5'],
exports: 'am5plugins_exporting',
init: function () {
return am5plugins_exporting;
}
},
'am5themes_Animated': {
deps: ['am5'],
init: function () {
return am5themes_Animated;
}
}
}
});
element.append('
');require(['am5', 'am5percent', 'am5themes_Animated', 'exporting'], function (am5, am5percent, am5themes_Animated, exporting) {
var root = am5.Root.new("chartdiv");
root.setThemes([
am5themes_Animated.new(root)
]);
var chart = root.container.children.push(
am5percent.PieChart.new(root, {})
);
// Create
var series = chart.series.push(
am5percent.PieSeries.new(root, {
name: "Series",
categoryField: "country",
valueField: "litres"
})
);
// Define data
series.data.setAll([{
"country": "Lithuania",
"litres": 9501.9
}, {
"country": "Czech Republic",
"litres": 301.9
}, {
"country": "Ireland",
"litres": 201.1
}, {
"country": "Germany",
"litres": 165.8
}, {
"country": "Australia",
"litres": 139.9
}, {
"country": "Austria",
"litres": 128.3
}, {
"country": "UK",
"litres": 99
}, {
"country": "Belgium",
"litres": 60
}, {
"country": "The Netherlands",
"litres": 50
}]);
// var title = chart.children.unshift(am5.Label.new(root, {
// text: "Sales by country ($M)",
// fontSize: 24,
// textAlign: "center",
// width: am5.p100,
// visible: false
// }));
// Export the chart as PNG
// Enable exporting
var exportings = am5plugins_exporting.Exporting.new(root, {
menu: am5plugins_exporting.ExportingMenu.new(root, {}),
pngOptions: {
maintainPixelRatio: true
},
});
exportings.export()
}, function (err) {
console.log(err);
});
but png image does nott export automatically. Though menu is created which only help in exporting manually. I would great help if u look into this. thanks.
@hkmoon my browser show warning manager-base.js:291 Failed to fetch ipywidgets through the "jupyter.widget.control" comm channel, fallback to fetching individual model state. Reason: Control comm was closed too early.
@ArsalanAli915 Please, use code block for pasting your code. It's not easy to read your code without it.
@hkmoon please take a look now.
%%javascript

require.config({
  paths: {
    d3: '//cdnjs.cloudflare.com/ajax/libs/d3/5.15.0/d3.min',
    am5: '//www.amcharts.com/lib/5/index',
    am5percent: '//www.amcharts.com/lib/5/percent',
    exporting: '//www.amcharts.com/lib/5/plugins/exporting',
    'am5themes_Animated': '//www.amcharts.com/lib/5/themes/Animated',
  },
  shim: {
    am5: {
      init: function () {
        return am5;
      }
    },
    am5percent: {
      deps: ['am5'],
      exports: 'am5xy',
      init: function () {
        return am5percent;
      }
    },
    exporting: {
      deps: ['am5'],
      exports: 'am5plugins_exporting',
      init: function () {
        return am5plugins_exporting;
      }
    },
    'am5themes_Animated': {
      deps: ['am5'],
      init: function () {
        return am5themes_Animated;
      }
    }
  }
});

element.append('<div id="chartdiv" style="height: 500px;"></div>');
require(['am5', 'am5percent', 'am5themes_Animated', 'exporting'], function (am5, am5percent, am5themes_Animated, exporting) {
  var root = am5.Root.new("chartdiv");

  root.setThemes([
    am5themes_Animated.new(root)
  ]);

  var chart = root.container.children.push(
    am5percent.PieChart.new(root, {})

  );

  // Create
  var series = chart.series.push(
    am5percent.PieSeries.new(root, {
      name: "Series",
      categoryField: "country",
      valueField: "litres"
    })
  );

  // Define data
  series.data.setAll([{
    "country": "Lithuania",
    "litres": 9501.9
  }, {
    "country": "Czech Republic",
    "litres": 301.9
  }, {
    "country": "Ireland",
    "litres": 201.1
  }, {
    "country": "Germany",
    "litres": 165.8
  }, {
    "country": "Australia",
    "litres": 139.9
  }, {
    "country": "Austria",
    "litres": 128.3
  }, {
    "country": "UK",
    "litres": 99
  }, {
    "country": "Belgium",
    "litres": 60
  }, {
    "country": "The Netherlands",
    "litres": 50
  }]);

//   var title = chart.children.unshift(am5.Label.new(root, {
//     text: "Sales by country ($M)",
//     fontSize: 24,
//     textAlign: "center",
//     width: am5.p100,
//     visible: false
//   }));

  // Export the chart as PNG
    // Enable exporting
    var exportings = am5plugins_exporting.Exporting.new(root, {
      menu: am5plugins_exporting.ExportingMenu.new(root, {}),
      pngOptions: {
        maintainPixelRatio: true
      },
    });
    exportings.export()

}, function (err) {
  console.log(err);
});
%%javascript

require.config({
  paths: {
     d3: '//cdnjs.cloudflare.com/ajax/libs/d3/5.15.0/d3.min',
     am5: '//www.amcharts.com/lib/5/index',
     am5percent: '//www.amcharts.com/lib/5/percent',
     am5plugins_exporting: '//www.amcharts.com/lib/5/plugins/exporting',
     'am5themes_Animated': '//www.amcharts.com/lib/5/themes/Animated',
  },
  shim: {
     am5: {
          init: function () {
              return am5;
          }
      },
      am5percent: {
          deps: ['am5'],
          exports: 'am5percent',
          init: function () {
              return am5percent;
          }
      },
      am5plugins_exporting: {
          deps: ['am5'],
          exports: 'am5plugins_exporting',
          init: function () {
              return am5plugins_exporting;
          }
      },
      'am5themes_Animated': {
          deps: ['am5'],
          init: function () {
              return am5themes_Animated;
          }
      }
  }
});

element.append('<div id="chartdiv" style="height: 500px;"></div>');

require(['am5', 'am5percent', 'am5themes_Animated', 'am5plugins_exporting'],
        function (am5, am5percent, am5themes_Animated, am5plugins_exporting) {
    var root = am5.Root.new("chartdiv");

    root.setThemes([
      am5themes_Animated.new(root)
    ]);

    var chart = root.container.children.push(
        am5percent.PieChart.new(root, {})
    );

    var series = chart.series.push(
        am5percent.PieSeries.new(root, {
            name: "Series",
            categoryField: "country",
            valueField: "litres"
        })
    );

    // Define data
    series.data.setAll([{
        "country": "Lithuania",
        "litres": 9501.9
    }, {
        "country": "Czech Republic",
        "litres": 301.9
    }, {
        "country": "Ireland",
        "litres": 201.1
    }, {
        "country": "Germany",
        "litres": 165.8
    }, {
        "country": "Australia",
        "litres": 139.9
    }, {
        "country": "Austria",
        "litres": 128.3
    }, {
        "country": "UK",
        "litres": 99
    }, {
        "country": "Belgium",
        "litres": 60
    }, {
        "country": "The Netherlands",
        "litres": 50
    }]);

    var exportings = am5plugins_exporting.Exporting.new(root, {
    menu: am5plugins_exporting.ExportingMenu.new(root, {}),
        pngOptions: {
            maintainPixelRatio: true
        },
    });
    exportings.export()
}, function (err) {
    console.log(err);
});
@hkmoon does the above script export automatically? please verify this. I was getting with my code same but its does not export automatically. thanks.
@ArsalanAli915 You can use download() or print() since this is based on web.
https://www.amcharts.com/docs/v5/concepts/exporting/exporting-api/#initiating-download-print
It cannot access to local file system in the web. However, you can pass a raw format binary data to the python context and save it locally.
exporting.export("png").then(function(imgData) {
  document.getElementById("myImage").src = imgData;
});
Hi hkmoon. Thanks for this script!!
Just wondering how would you load a Pandas DataFrame into this script when working in the jupyter Notebook? I cant find this referred to in the amCharts documentation unfortunately.
In your example you have inserted the data as JSON manually. E.g. would you do the following in a jupyter Notebook "Cell" before this code, to import a csv file into Pandas and convert to JSON first?
import pandas as pd data = pd.read_csv("file.csv", parse_dates=[0]) **json** = data.to_json(orient = 'index')And than to call to it into the "chart.data". Just like this?
chart.data = **json**Is this how you would do this?
Looking forward to your feedback.
Thanks again.