-
-
Save lassoan/b445c734f118a5fb7643f3fb05f98b07 to your computer and use it in GitHub Desktop.
| # Get a dental CT scan | |
| import SampleData | |
| volumeNode = SampleData.SampleDataLogic().downloadDentalSurgery()[1] | |
| # Define curve | |
| curveNode = slicer.mrmlScene.AddNewNodeByClass('vtkMRMLMarkupsCurveNode') | |
| curveNode.CreateDefaultDisplayNodes() | |
| curveNode.GetCurveGenerator().SetNumberOfPointsPerInterpolatingSegment(25) # add more curve points between control points than the default 10 | |
| curveNode.AddControlPoint(vtk.vtkVector3d(-45.85526315789473, -104.59210526315789, 74.67105263157896)) | |
| curveNode.AddControlPoint(vtk.vtkVector3d(-50.9078947368421, -90.06578947368418, 66.4605263157895)) | |
| curveNode.AddControlPoint(vtk.vtkVector3d(-62.27631578947368, -78.06578947368419, 60.7763157894737)) | |
| curveNode.AddControlPoint(vtk.vtkVector3d(-71.86705891666716, -58.04403581456746, 57.84679891116521)) | |
| curveNode.AddControlPoint(vtk.vtkVector3d(-74.73084356325877, -48.67611043794342, 57.00664267528636)) | |
| curveNode.AddControlPoint(vtk.vtkVector3d(-88.17105263157895, -35.75, 55.092105263157904)) | |
| curveNode.AddControlPoint(vtk.vtkVector3d(-99.53947368421052, -35.75, 55.092105263157904)) | |
| curveNode.AddControlPoint(vtk.vtkVector3d(-107.75, -43.96052631578948, 55.092105263157904)) | |
| curveNode.AddControlPoint(vtk.vtkVector3d(-112.80263157894736, -59.118421052631575, 56.355263157894754)) | |
| curveNode.AddControlPoint(vtk.vtkVector3d(-115.32894736842104, -73.01315789473684, 60.144736842105274)) | |
| curveNode.AddControlPoint(vtk.vtkVector3d(-125.43421052631578, -83.74999999999999, 60.7763157894737)) | |
| curveNode.AddControlPoint(vtk.vtkVector3d(-132.3815789473684, -91.96052631578947, 63.934210526315795)) | |
| curveNode.AddControlPoint(vtk.vtkVector3d(-137.43421052631578, -103.96052631578947, 67.72368421052633)) | |
| sliceNode = slicer.mrmlScene.GetNodeByID('vtkMRMLSliceNodeRed') | |
| rotationAngleDeg = 180 | |
| sliceNode.SetFieldOfView(40,40,1) # zoom in | |
| appLogic = slicer.app.applicationLogic() | |
| sliceLogic = appLogic.GetSliceLogic(sliceNode) | |
| sliceLayerLogic = sliceLogic.GetBackgroundLayer() | |
| reslice = sliceLayerLogic.GetReslice() | |
| reslicedImage = vtk.vtkImageData() | |
| # Straightened volume (useful for example for visualization of curved vessels) | |
| straightenedVolume = slicer.modules.volumes.logic().CloneVolume(volumeNode, 'straightened') | |
| # Capture a number of slices orthogonal to the curve and append them into a volume. | |
| # sliceToWorldTransform = curvePointToWorldTransform * RotateZ(rotationAngleDeg) | |
| curvePointToWorldTransform = vtk.vtkTransform() | |
| sliceToWorldTransform = vtk.vtkTransform() | |
| sliceToWorldTransform.Concatenate(curvePointToWorldTransform) | |
| sliceToWorldTransform.RotateZ(rotationAngleDeg) | |
| sliceNode.SetXYZOrigin(0,0,0) | |
| numberOfPoints = curveNode.GetCurvePointsWorld().GetNumberOfPoints() | |
| append = vtk.vtkImageAppend() | |
| for pointIndex in range(numberOfPoints): | |
| print(pointIndex) | |
| curvePointToWorldMatrix = vtk.vtkMatrix4x4() | |
| curveNode.GetCurvePointToWorldTransformAtPointIndex(pointIndex, curvePointToWorldMatrix) | |
| curvePointToWorldTransform.SetMatrix(curvePointToWorldMatrix) | |
| sliceToWorldTransform.Update() | |
| sliceNode.GetSliceToRAS().DeepCopy(sliceToWorldTransform.GetMatrix()) | |
| sliceNode.UpdateMatrices() | |
| slicer.app.processEvents() | |
| tempSlice = vtk.vtkImageData() | |
| tempSlice.DeepCopy(reslice.GetOutput()) | |
| append.AddInputData(tempSlice) | |
| append.SetAppendAxis(2) | |
| append.Update() | |
| straightenedVolume.SetAndObserveImageData(append.GetOutput()) | |
| # Create panoramic volume by mean intensity projection along an axis of the straightened volume | |
| import numpy as np | |
| panoramicVolume = slicer.modules.volumes.logic().CloneVolume(straightenedVolume, 'panoramic') | |
| panoramicImageData = panoramicVolume.GetImageData() | |
| straightenedImageData = straightenedVolume.GetImageData() | |
| panoramicImageData.SetDimensions(straightenedImageData.GetDimensions()[2], straightenedImageData.GetDimensions()[1], 1) | |
| panoramicImageData.AllocateScalars(straightenedImageData.GetScalarType(), straightenedImageData.GetNumberOfScalarComponents()) | |
| panoramicVolumeArray = slicer.util.arrayFromVolume(panoramicVolume) | |
| straightenedVolumeArray = slicer.util.arrayFromVolume(straightenedVolume) | |
| panoramicVolumeArray[0, :, :] = np.flip(straightenedVolumeArray.mean(2).T) | |
| slicer.util.arrayFromVolumeModified(panoramicVolume) | |
| panoramicVolume.SetSpacing(4.0, 0.5, 0.5) # just approximate spacing (would need to properly compute from FOV and image size) | |
| sliceNode.SetOrientationToAxial() | |
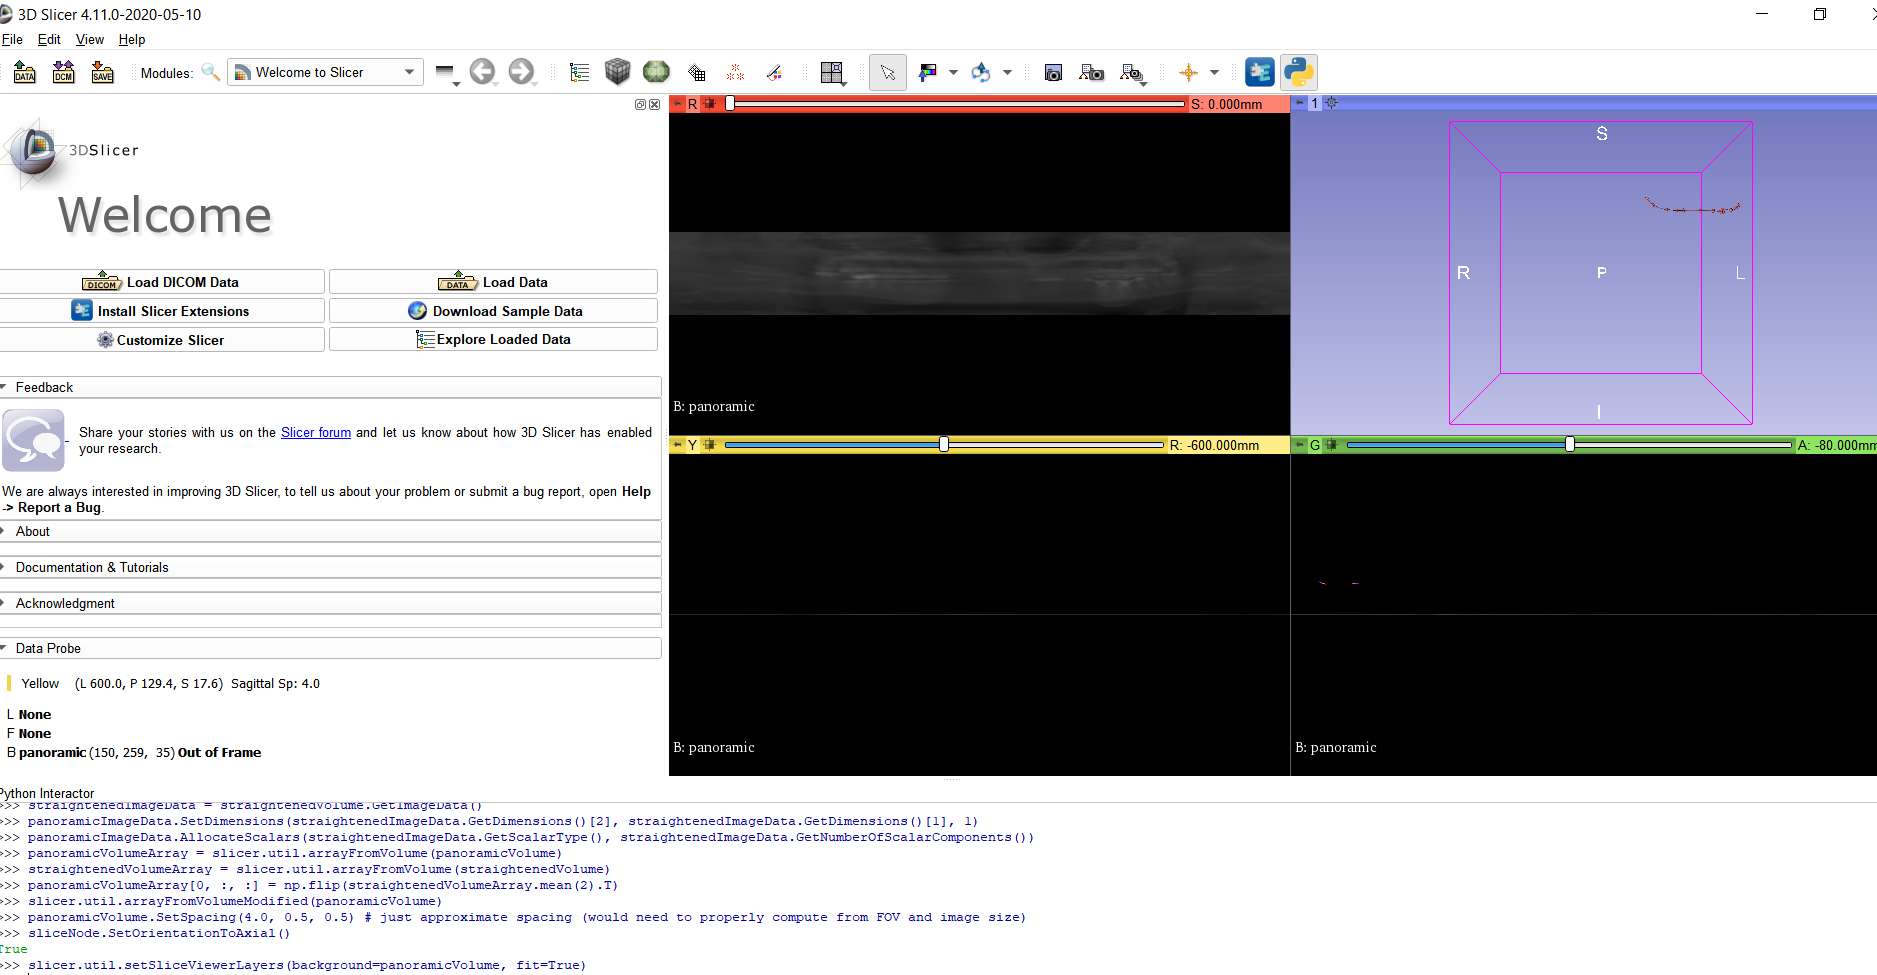
| slicer.util.setSliceViewerLayers(background=panoramicVolume, fit=True) |
If I run the code snippet above on current Slicer Preview Release then I get this:

Please try again on the latest Slicer Preview Release. Also note that now Curved Planar Reformatting is available as a Slicer module, in Sandbox extension (in Examples category in the Extension Manager).
thank you, with the new version it is working.
Another question, I have different curves generated (in "segment editor -> draw tube") and saved in one vtk file, how can I use them (seperately) instead of adding the fixed points in this example?
Many thanks in advance
Please post any further questions on the Slicer forum (https://discourse.slicer.org) to allow others to discover, join and/or learn from the discussion.
That code was completely reworked and made much more robust and a module with a convenient GUI was created from it. The "Cuved Planar Reformat" module is available in the Sandbox extension and you can use it either via GUI or Python script.
Hi Lassoan, Thanks for the code.
I am a university student I want to run this code, I have cbct dental dicom dataset, how can I run this code can you please tell?
A full example that shows how to use the code from Python script is available here: https://github.com/PerkLab/SlicerSandbox/blob/14753dfb8f53e59609a5e0a46a25d02dbab2cff4/CurvedPlanarReformat/CurvedPlanarReformat.py#L525-L561
Thanks for replying sir.
Actually I want to run the code on my dataset and generate the panoramic view in image(jpg) form. I donot need 3d slicer or any kind of application.
How can I implement this?
You need 3D Slicer if you want to use this solution. However, you don't have to use the application GUI, but you can use a short Python script to load the data (3D image and the reformatting curve), run the processing, and save the results to file.
the script you provided in this link (https://github.com/PerkLab/SlicerSandbox/blob/14753dfb8f53e59609a5e0a46a25d02dbab2cff4/CurvedPlanarReformat/CurvedPlanarReformat.py#L525-L561) is generating libraries error:
from slicer.ScriptedLoadableModule import * - in this import
You can run the script in Slicer's Python environment. For example, you can copy those lines into a something.py and run it using Slicer --python-script /path/to/something.py. Probably you need to make some trivial changes, such as add import CurvedPlanarReformat and replace logic = CurvedPlanarReformatLogic() by logic = CurvedPlanarReformat.CurvedPlanarReformatLogic().
Thank you.
but I donot want to run this in slicer's python environment, I want to run this as a flask API, in which I will pass the dicom cbct images and get the panoramic images as response. Can you please help in this ?
That's fine, you can execute path/to/Slicer --python-script path/to/someprocessing.py from flask script. You can also have a Slicer instance running and use its findings via the Slicer REST API (then you don't need to wait for Slicer application to start, but you need to wait or start another Slicer instance if there are multiple requests at the range time).
Note that the having the CBCT images are not sufficient for computing panoramic X-ray. You also need the curve among you want to reformat (curve connecting the center of the teeth crowns). There are many AI models for teeth segmentation that you could use to get the curve but I'm not sure if there are any good quality ones available for free.
Thanks Again.
But I only want to use my dataset not the SampleData you have used. How can I proceed in this ?
I have 288 dicom images of cbct series, I have generated axial, saggital, coronal and also 3d rendering view from these images, the last thing I want to generate is the panoramic view. I am unable to generate it.
Let's continue this at the Slicer forum - https://discourse.slicer.org - where more people can contribute to and learn from the discussion.
Hi Andras, thanks for the code. I have run it as it is on sample data but the result is not promising, could you please let me know if I am missing something or the code needs to be modified? Thanks