Created
November 2, 2018 15:11
-
-
Save linnil1/9f8a8e2d4bc6e41f18240d85dbb2be78 to your computer and use it in GitHub Desktop.
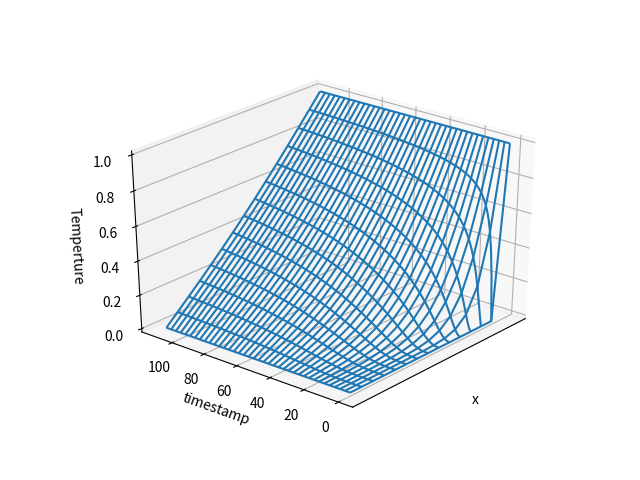
Use implicit numerical methods to calculate trasient heat temperture.
This file contains bidirectional Unicode text that may be interpreted or compiled differently than what appears below. To review, open the file in an editor that reveals hidden Unicode characters.
Learn more about bidirectional Unicode characters
| from mpl_toolkits.mplot3d import axes3d | |
| import numpy as np | |
| import matplotlib.pyplot as plt | |
| n = 15 | |
| fo = 0.5 | |
| grid = np.zeros(n) | |
| esp = 1e-3 | |
| max_iter = None | |
| def init(): | |
| grid[:] = 0 | |
| grid[0] = 0 | |
| grid[-1] = 1 | |
| def setMatrix(fo, n): | |
| a = np.eye(n) | |
| i = np.arange(n - 2) | |
| a[i + 1, i] = -fo | |
| a[i + 1, i + 1] = 1 + 2 * fo | |
| a[i + 1, i + 2] = -fo | |
| return getInv(a) | |
| def getInv(a): | |
| s = a.shape[0] | |
| ad = np.hstack([a, np.eye(s)]) | |
| for i in range(s): | |
| # print(i) | |
| # print(ad) | |
| ad[i, :] /= ad[i, i] | |
| j = np.arange(s) | |
| j = j[j != i] | |
| ad[j, :] -= ad[i, :] * ad[j, i, np.newaxis] | |
| return ad[:, s:] | |
| # main | |
| init() | |
| it = 0 | |
| history_grid = [] | |
| ainv = setMatrix(fo, n) | |
| while True: | |
| it += 1 | |
| history_grid.append(grid) | |
| grid = np.dot(ainv, grid) | |
| if not (np.abs(grid - history_grid[-1]) > esp).any(): | |
| break | |
| if max_iter and it >= max_iter: | |
| break | |
| print(it) | |
| print(grid) | |
| ax = plt.gca(projection='3d') | |
| X, Y = np.meshgrid(np.arange(n), np.arange(it)) | |
| ax.plot_wireframe(X, Y, np.array(history_grid)) | |
| ax.set_xlabel('x') | |
| ax.set_ylabel('timestamp') | |
| ax.set_zlabel('Temperture') | |
| plt.xticks([]) | |
| ax.view_init(azim=-140) | |
| plt.savefig("heat_transient_matrix.png") | |
| plt.show() |
Author
linnil1
commented
Nov 2, 2018
Sign up for free
to join this conversation on GitHub.
Already have an account?
Sign in to comment