The Vera C. Rubin Observatory Legacy Survey of Space and Time (LSST), will generate data of the order of TBs and will send out a stream of around 10 million alerts per night. LSST has committed to making a part of the useful data it collects public in the form of alerts generated in real-time. AstroLab Software has developed Fink, an Apache Spark based broker infrastructure, which is able to analyze large streams of alerts data from the telescopes like LSST, and then redistribute it to subscribers, enabling a wide range of applications and services to consume this data. This processed data needs to be stored for visualizing and post-processing. The efficient manipulation and visualization of patterns in this extremely large dataset is a real challenge for which we created grafink as part of GSoC 2020.
Initial proposal put forth, primarily, a plan to create a data loading tool to load LSST data into JanusGraph backed by HBase as the storage layer. It was also desired to provide an easy to use user interface to visualize, manipulate and analyze data loaded into the graph. Much of the initial ideas were developed and executed, culminating into grafink, which is a generic, scalable ETL tool to load data into JanusGraph at scale.
You can find some benchmark numbers about the time taken to ingest vertices and edges via grafink here
All the development carried out towards the project was done via Pull Requests on the following github repository:
Grafink is written entirely in scala programming language, and the code is purely functional. All the documentation, including architecture and benchmarks also rest within the same respostitory.
Some interesting stats about the development
| Stat | Value |
|---|---|
| # of PRs merged (as of this writing) | 20 |
| # of Vertex classifiers (edge creation algorithms) supported | 3 |
| # of open source projects used | 14+ |
| # of unit test cases (as of this writing) | 48 |
Outlined below is a detailed description of the grafink source development and testing, laid out in terms of weekly work:
The first few PRs added the basic framework for grafink and some documentation about data loading strategies
- PR #2 added the following:
- Packaging of the jar, config files and a run script.
- Basic code formatter
- Travis CI job file
- A command line parser for passing arguments to the job
- Added documentation about multiple strategies of loading data into Janusgraph, including architecture.
- During the same time, we were also able to finalize the data loading strategy that we would like to try first, which is described in this option
- Introduced ZIO framework to grafink, which is a zero dependency scala IO library for asynchronous and concurrent programming. This made the code purely functional, adding multiple benefits.
- Added IDManager which would generate and manage the custom ids for the vertex data loaded into JanusGraph.
This time was primarily spent in adding the logic for agreed upon data loading approach.
Here is the architecture diagram explaining the whole flow:
You can read more about the Architecture here
This work was perhaps the biggest PR #7, which added the following:
- read the data in parquet format, partitioned by day, month, year
- preserve only some of the columns directly or by renaming nested columns
- generate unique ids which will be used as custom vertex ids when ingesting data into JanusGraph.
The problem of adding unique ids to a large distributed dataset is much more complex than generating unique ids for a small dataset. While this is a standard sql functionality (
AUTO_INCREMENT) , this is not yet supported in spark. To support it efficiently for our case, we first add a dummy column with all 0s, then usezipWithIndexfunction from RDD , and set this column value to offset + index value, code here - skip schema loading in case the target table with schema already exists in Janusgraph backend storage. We check this by getting the vertex labels from the janusgraph instance, and if any exist, we skip loading schema.
- Rule-based EdgeProcessor: We can pass in a list of rules, each of which will add a set of edges to the graph
- SimilarityClassifier: This is one such rule, that adds edges to the graph based on "similarity" of certain fields in the alerts. Read more about SimilarityClassifier here
- created a generic way of expressing the
similaritycondition, using column names and operator "AND" and "OR", so, for example:
(rfscore AND snnscore) OR mulens OR classtar OR roid OR cdsxmatch OR objectId
expresses the condition that when rfscore and snnscore or mulens or classtar or roid or cdsxmatch or objectId matches between any 2 vertices, we will create a similarity edge between them. Note that the definition of matches varies per column and is not an equality match here.
- optimizations for loading edges via SimilarityClassifier (parallelism for edge loading, using spark df api instead of udfs etc)
- optimized janusgraph configurations for bulk-loading data like turning off schema checks etc.
- added unit tests and increased the code coverage to ~ 64.90 %
- prevent duplicate source and destination vertex combinations when loading edges using similarityclassifier. This is because similarity classifier uses a
cartesian joinof the data with itself to generate these combinations. One (more compute intensive) solution is to get the result from join, then take a min and max of the ids in the joined rows, assigning them id1 and id2 labels and then taking a distinct over these columns:
select distinct
       case when a.id<=b.id then a.id else b.id end id1,
       case when a.id<=b.id then b.id else a.id end id2
from A cross join B
In spark you could also use the least and greatest function to achieve the case when conditions.
The more straightforward solution which I used
select A.id,B.id from A cross join B on A.id > B.id
(did not use >= since we do not need edges from vertices to itself)
This solution was contributed to stackoverflow thread here
Following new features / bug fixes were added in these weeks:
- Made the EdgeLoader interface generic, so new VertexClassifier rules could be added to support loading new
setof edges in the graph.
- Fixed a minor bug with sbt build info plugin project name.
- Updated the architecture diagram to reflect the final approach taken.
- Added support for data deletion and data indexing. A new command line parameter was introduced to run grafink in
deletemode instead of normal ingestion mode. - A configurable option (defaulting to false) was also added to clear IDManager data after successful vertex deletion. No need to clear edges as they are automatically dropped on dropping vertices.
- Added support for all 3 types of indices supported by JanusGraph: Composite, Mixed and Vertex-Centric Indices.
- All these indices are again configurable, but will only take effect when schema is loaded for a particular graph.
- Mixed Indices require running an Indexing backend like Elasticsearch. But if there are no mixed indices configured, Elasticsearch is not needed.
Once data is loaded into JanusGraph, users need some interface to query and analyze the loaded data. For that, an interactive shell interface was added as part of PR #22
- Grafink-shell is an interactive scala REPL, based off the Ammonite REPL project
- Suppoprts syntax highlighting, multi-line editing support, pretty printing of objects etc, so it is much better than the default gremlin console that JanusGraph is normally used with.
- The shell can be run and passed the same configuration file as a CL parameter that is used to load the data (using grafink job), so it connects to the target HBase table to query the data.
- Another useful addition is that we can create methods for common queries and those will be automatically available in the shell for use by the users.
Apart from the command line shell, we needed a tool to visualize the graph data, and for that we came across graphexp that closely matched our expectations.
I was able to get it to connect with the loaded data and inspect the graph visually:
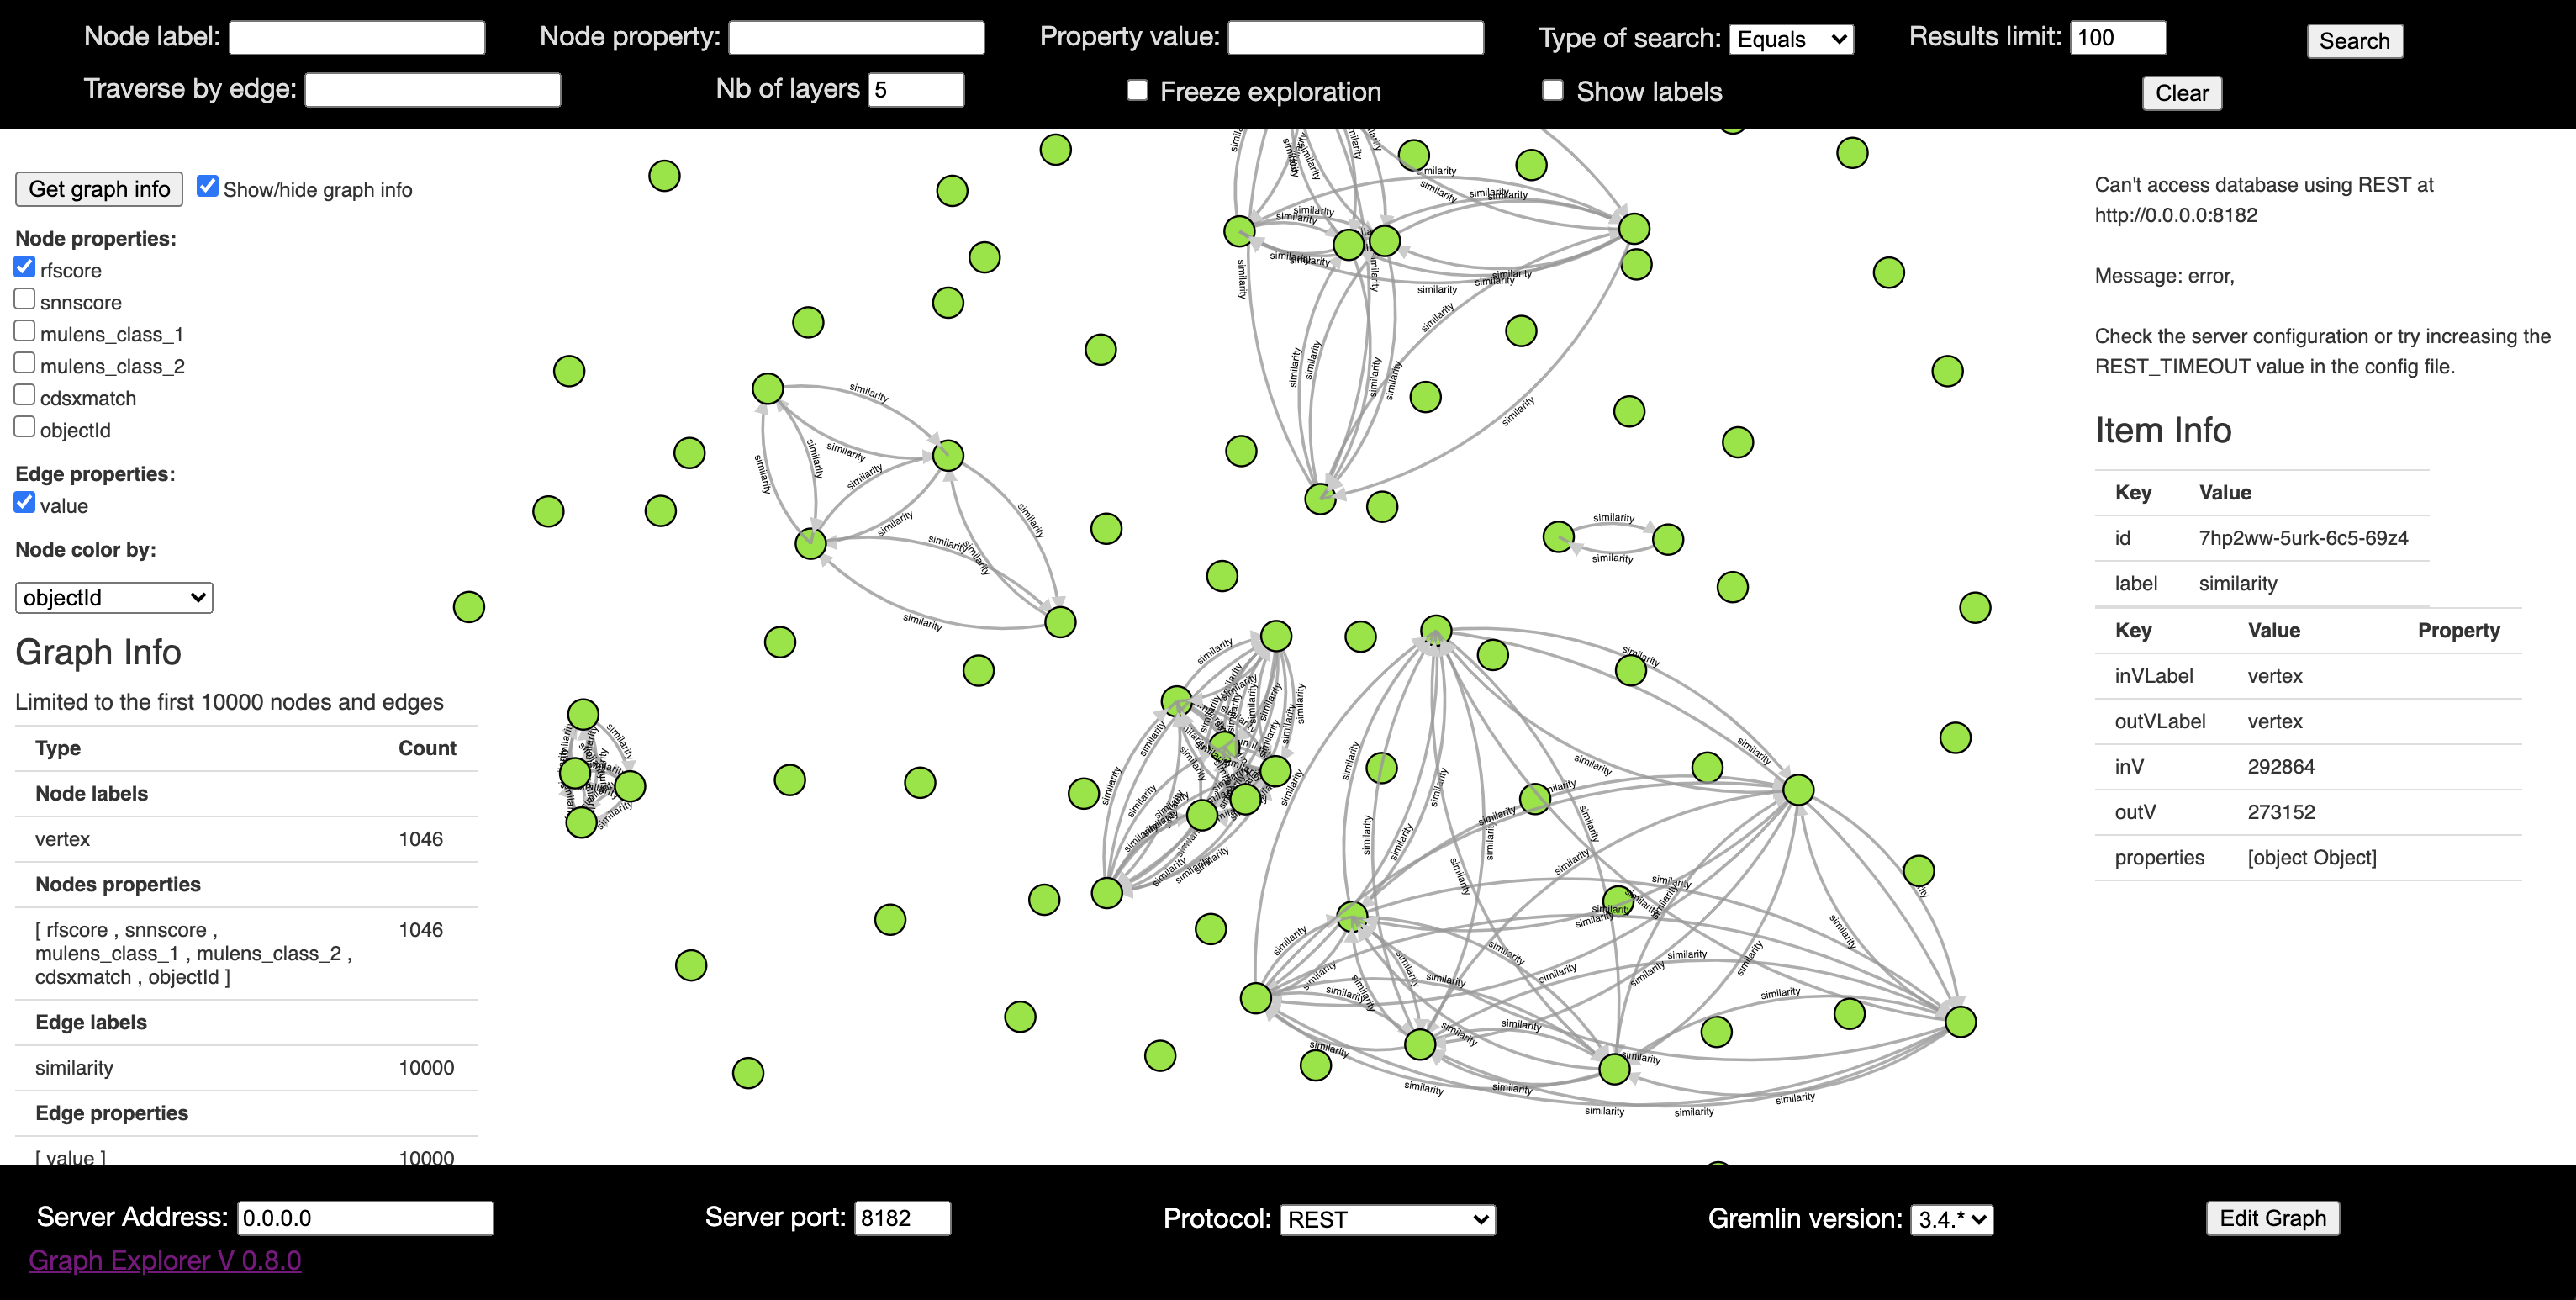
But there are certain disadvantages with the currently available open source tools:
- These tools mostly work on top of gremlin REST interface, and the request model requires user to send a gremlin script to be executed. Moreover the grelmin REST interface is too generic.
- No option to chose different graphs (different backend tables)
- Limited query types are supported in graphexp.
This led me to start another (read ambitious) project grafink-ui, which is a react app to create the tool exactly as we desire. But unfortunately due to lack of time and other more important features this tool is not yet complete.
While coming up with a visualization tool, I had realized that a better (more custom) REST interface was desired. PR #28 was added for this purpose. The additions it brings:
- split the grafink code into 3 sub-projects: common, core and api.
- exposed a single endpoint
/infofor getting the schema information about the graph backed by supplied HBase table - uses a simple cache to cache the JanusGraph connection objects to HBase backend. This prevents API slowdown when calling APIs for the same HBase tables. Currently, this is a very basic implementation, which will keep on caching these graph objects till the cache is full, where the cache limit is configurable.
- adds a new vertex property
rowkeyto the vertex data, which is added by adding a new column to the raw data. To handle this case in a generic way, I added another configuration option which lets the user add any new column as a result of sql function over existing columns, for eg:
keepColsRenamed =
  [ { "f": "mulens.class_1", "t": "mulens_class_1" },
    { "f": "mulens.class_2", "t": "mulens_class_2" },
    { "f": "candidate.jd", "t": "jd" }
  ]
newCols = [
  { "name": "rowkey", "expr": "objectId || '_' || jd as rowkey" }
]
So this will add a new column rowkey to the data read from the job using SQL concat operator over objectId and jd columns where jd is defined as a renamed column from candidate.jd column
Due to limited time, I could not yet add other query endpoints, but the existing api module can now be easily extended.
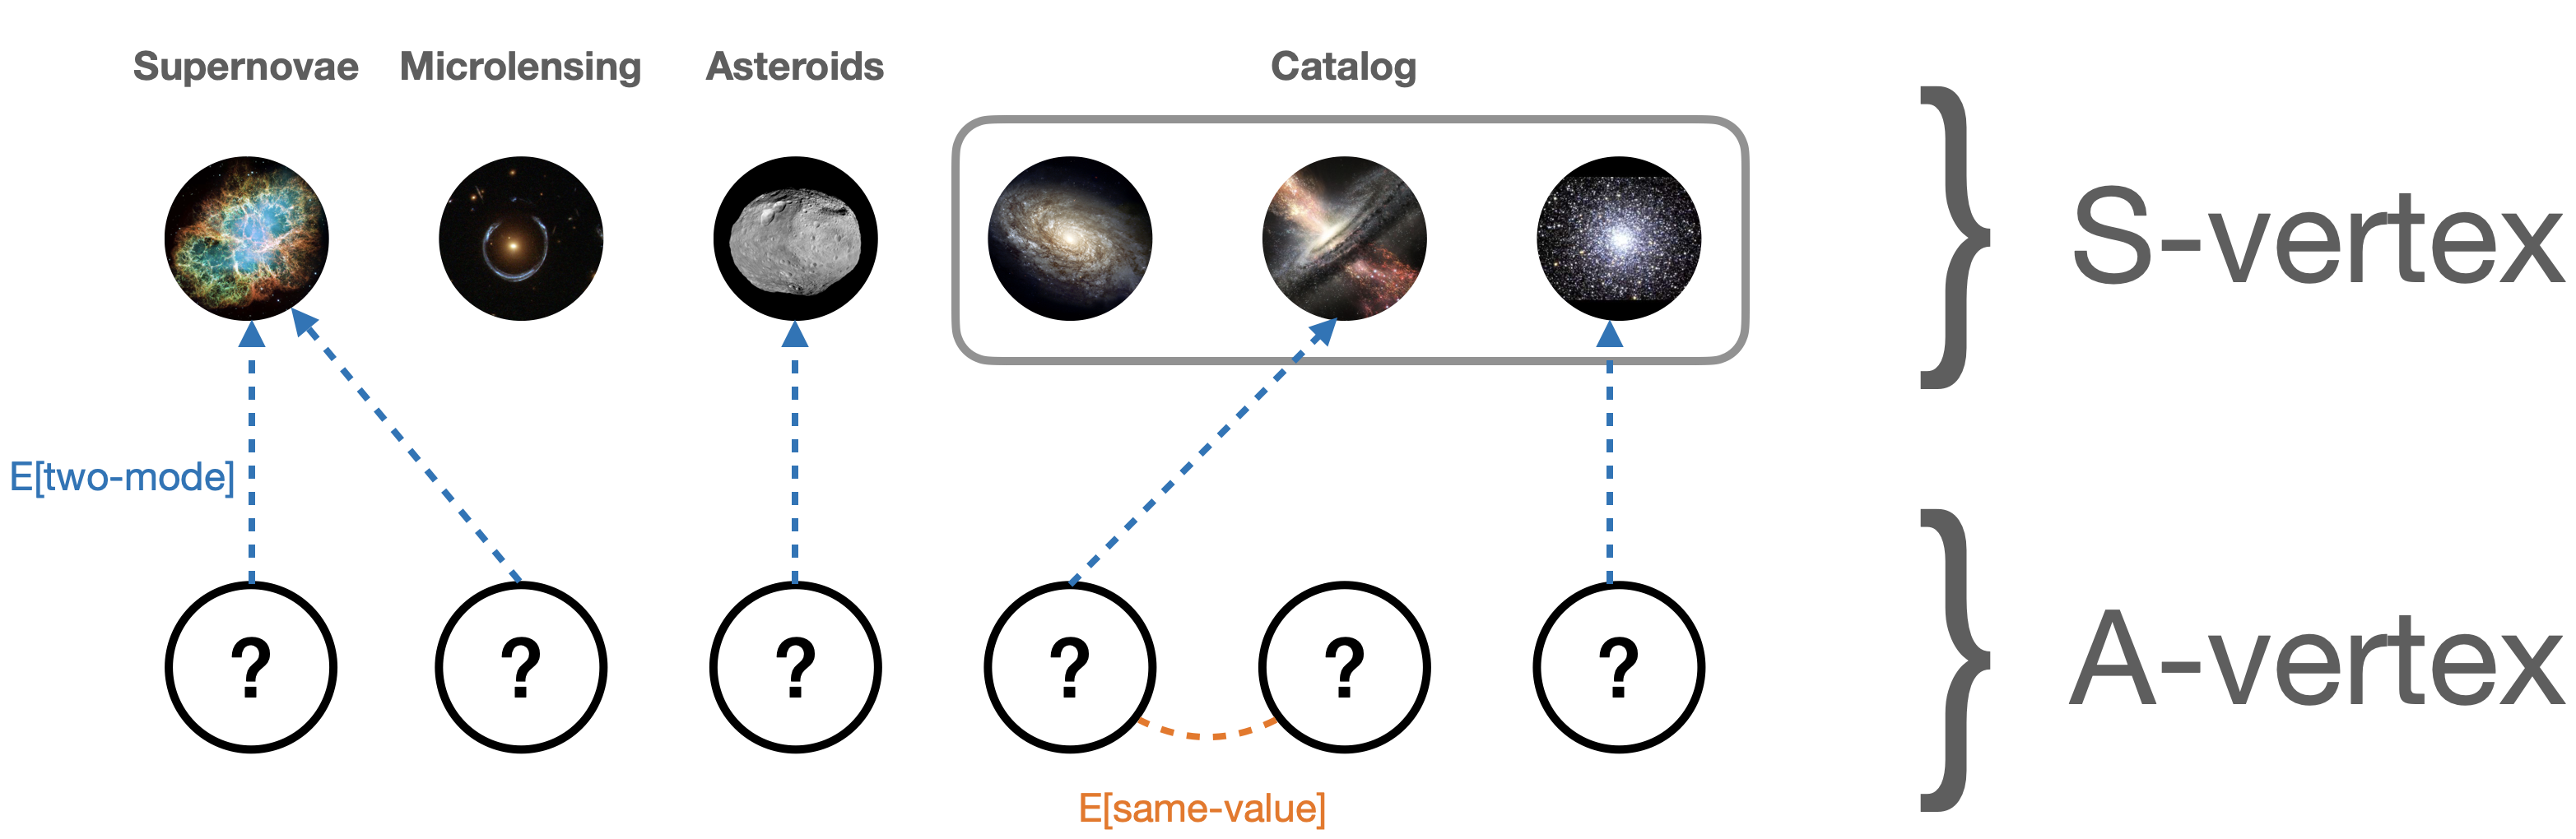
We decided to go for the original Two Mode approach to loading data into JanusGraph, since SimilarityClassifier required a cartesian join which was becoming too expensive as the data size grew. PR #31 added support for these new classifiers:
- TwoModeClassifier: A VertexClassifier rule that links alert data to some fixed
similarityvertices, based on the recipe rule specified for thatsimilarityvertex. Read more about the TwoModeClassifier here - SameValueClassifier: A VertexClassifier rule that connects all vertices having the same value for a particular vertex property. This is a generic classifier rule that can be used to create edges in any dataset. Read more about the SameValueClassifier here
- Fixes a critical bug in the data ingestion path due to which the source parquet data which was being loaded was not matching the actual graph data after loading the data. I discovered that the JanusGraph APIs to commit the transaction after adding vertices or edges are not reliable for grouping or batching the addition of new elements while bulk-loading the data in parallel. That is why we reverted to committing the transaction after adding each and every vertex or edge while loading the data.
- Also adds more unit tests to increase coverage.
So instead of loading edges via SimilarityClassifier, we switch to TwoModeClassifier and SameValueClassifier. The difference being:
- Need to query in and out edges from alert data to similarity vertex to discover links.
- Eliminates the need for any cartesian join, thereby reducing the data loading time from almost an hour to a few minutes!
- Much more scalable.
The current graph structure hence looks like this:
Week 12, Week 13: Bug Fixes, unit tests, documentation and changes to properties based on study of loaded data
This time was primarily spent in bug fixing, adding unit tests, updating documentation and renaming of few properties based on recommendations from Julien (My mentor for this work), based on a very nice data analysis study using the grafink shell which can be read about here PR #38 adds the following changes:
- Adds several new vertex properties like
snn_sn_vs_all,candidate.raetc. - Modify the supernova recipe rule to a more complex implementation described here.
PR #37, PR #39, PR #40 add documentation changes based on new properties and similarity definitions, vertex classifiers and benchmarks.
PR #41 fixed another edge number mismatch bug.
Grafink has been created as a generic data loader tool for JanusGraph, that can handle large amounts of data. Currently, there is no such tool in the open source space and grafink fills that gap, apart from serving the purpose of this project. I had tremendous fun building all the stuff for this project, and had excellent support from my mentors all throughout. I would like to thank my mentors, especially Julien for all his help, prompt replies and kind words. The software pieces we have created are far from over and there are a lot of possibilities for extending this work, some of which are described below:
- Add an example documentation (config) for loading some known standard graph dataset into JanusGraph.
- Add support for query APIs in the api module of grafink. Add documentation for the same using a tool like swagger.
- Complete grafink-ui by using the rest APIs from grafink api module for easy visualization of the data.
- Some other useful features like preventing recomputation of IDManager data in case it already exists for a given duration.
- Dockerize grafink job and api.
- Add more VertexClassifier rules that are generic, probably based on some ML models.
- Add a documentatiion website for grafink.