Last active
April 21, 2020 16:07
-
-
Save sergiolucero/9f3128355412d51458cc407b864c6227 to your computer and use it in GitHub Desktop.
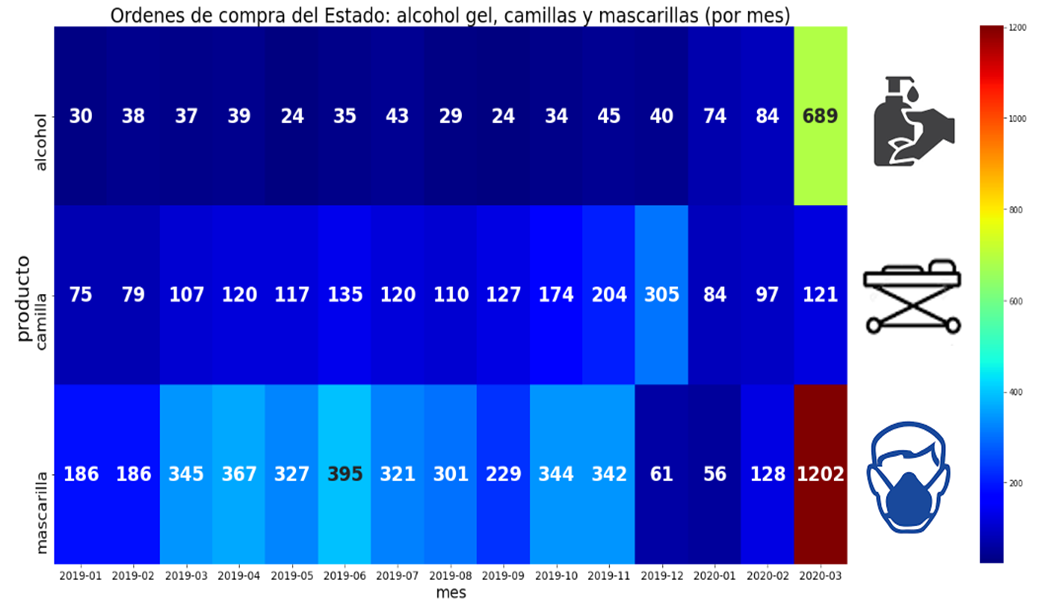
heatmap Mercado Público
This file contains bidirectional Unicode text that may be interpreted or compiled differently than what appears below. To review, open the file in an editor that reveals hidden Unicode characters.
Learn more about bidirectional Unicode characters
| from sqlib import sql # acceso a BD local | |
| import seaborn as sns | |
| import matplotlib.pyplot as plt | |
| def heatmap(some_counts, title, value_var='N', annot_fontsize=24): | |
| fig, ax = plt.subplots(1, figsize=(24,12)) | |
| print(some_counts.columns) | |
| pivot = some_counts.pivot_table(index='producto', columns='AñoMes', values=value_var) | |
| p=sns.heatmap(pivot, annot=True, annot_kws={'size': annot_fontsize, | |
| 'weight': 'bold'}, fmt='.0f', cmap='jet') | |
| _ = p.set_title(title, size=24) | |
| plt.xlabel('mes', fontsize=20) | |
| plt.xticks(fontsize=14) | |
| plt.ylabel('producto', fontsize=24) | |
| plt.yticks(fontsize=20) | |
| ################################################################ | |
| counts = sql('SELECT producto, AñoMes, COUNT(*) AS N FROM todos \ | |
| GROUP BY producto, AñoMes ORDER BY N DESC') | |
| counts['Año'] = counts['AñoMes'].apply(lambda am: am[:4]) # formato | |
| last_counts = counts[counts.AñoMes>'2019'] # 2010-2015 separado | |
| heatmap(last_counts, title='Compras Mensuales Insumos COVID-19') |
Author
sergiolucero
commented
Apr 21, 2020
Sign up for free
to join this conversation on GitHub.
Already have an account?
Sign in to comment