We are happy to announce the release of Kuma 0.4! This is a major release focused on significantly better observability capabilities, that also includes many new features and improvements across the board.
This release also marks the 10th release of Kuma since September 2019! We are very proud of the release momentum we have executed so far, and we are looking forward to accelerating the delivery of more advanced L7 features within the next few months, as well as more advanced networking support for more complex Service Mesh deployments across hybrid environments.
- A new Traffic Trace policy that allows to configure tracing on L7 HTTP traffic.
- Three official Grafana dashboards to visualize traffic metrics collected by Prometheus.
- For Kubernetes, selective sidecar injection capability has been introduced.
- For Universal deployments, a new Dataplane format to better support
gatewayuse-cases. - Introducing a new
protocoltag to support different L7 protocols. - And much more.
For a complete list of features and updates, you can take a look at the full changelog.
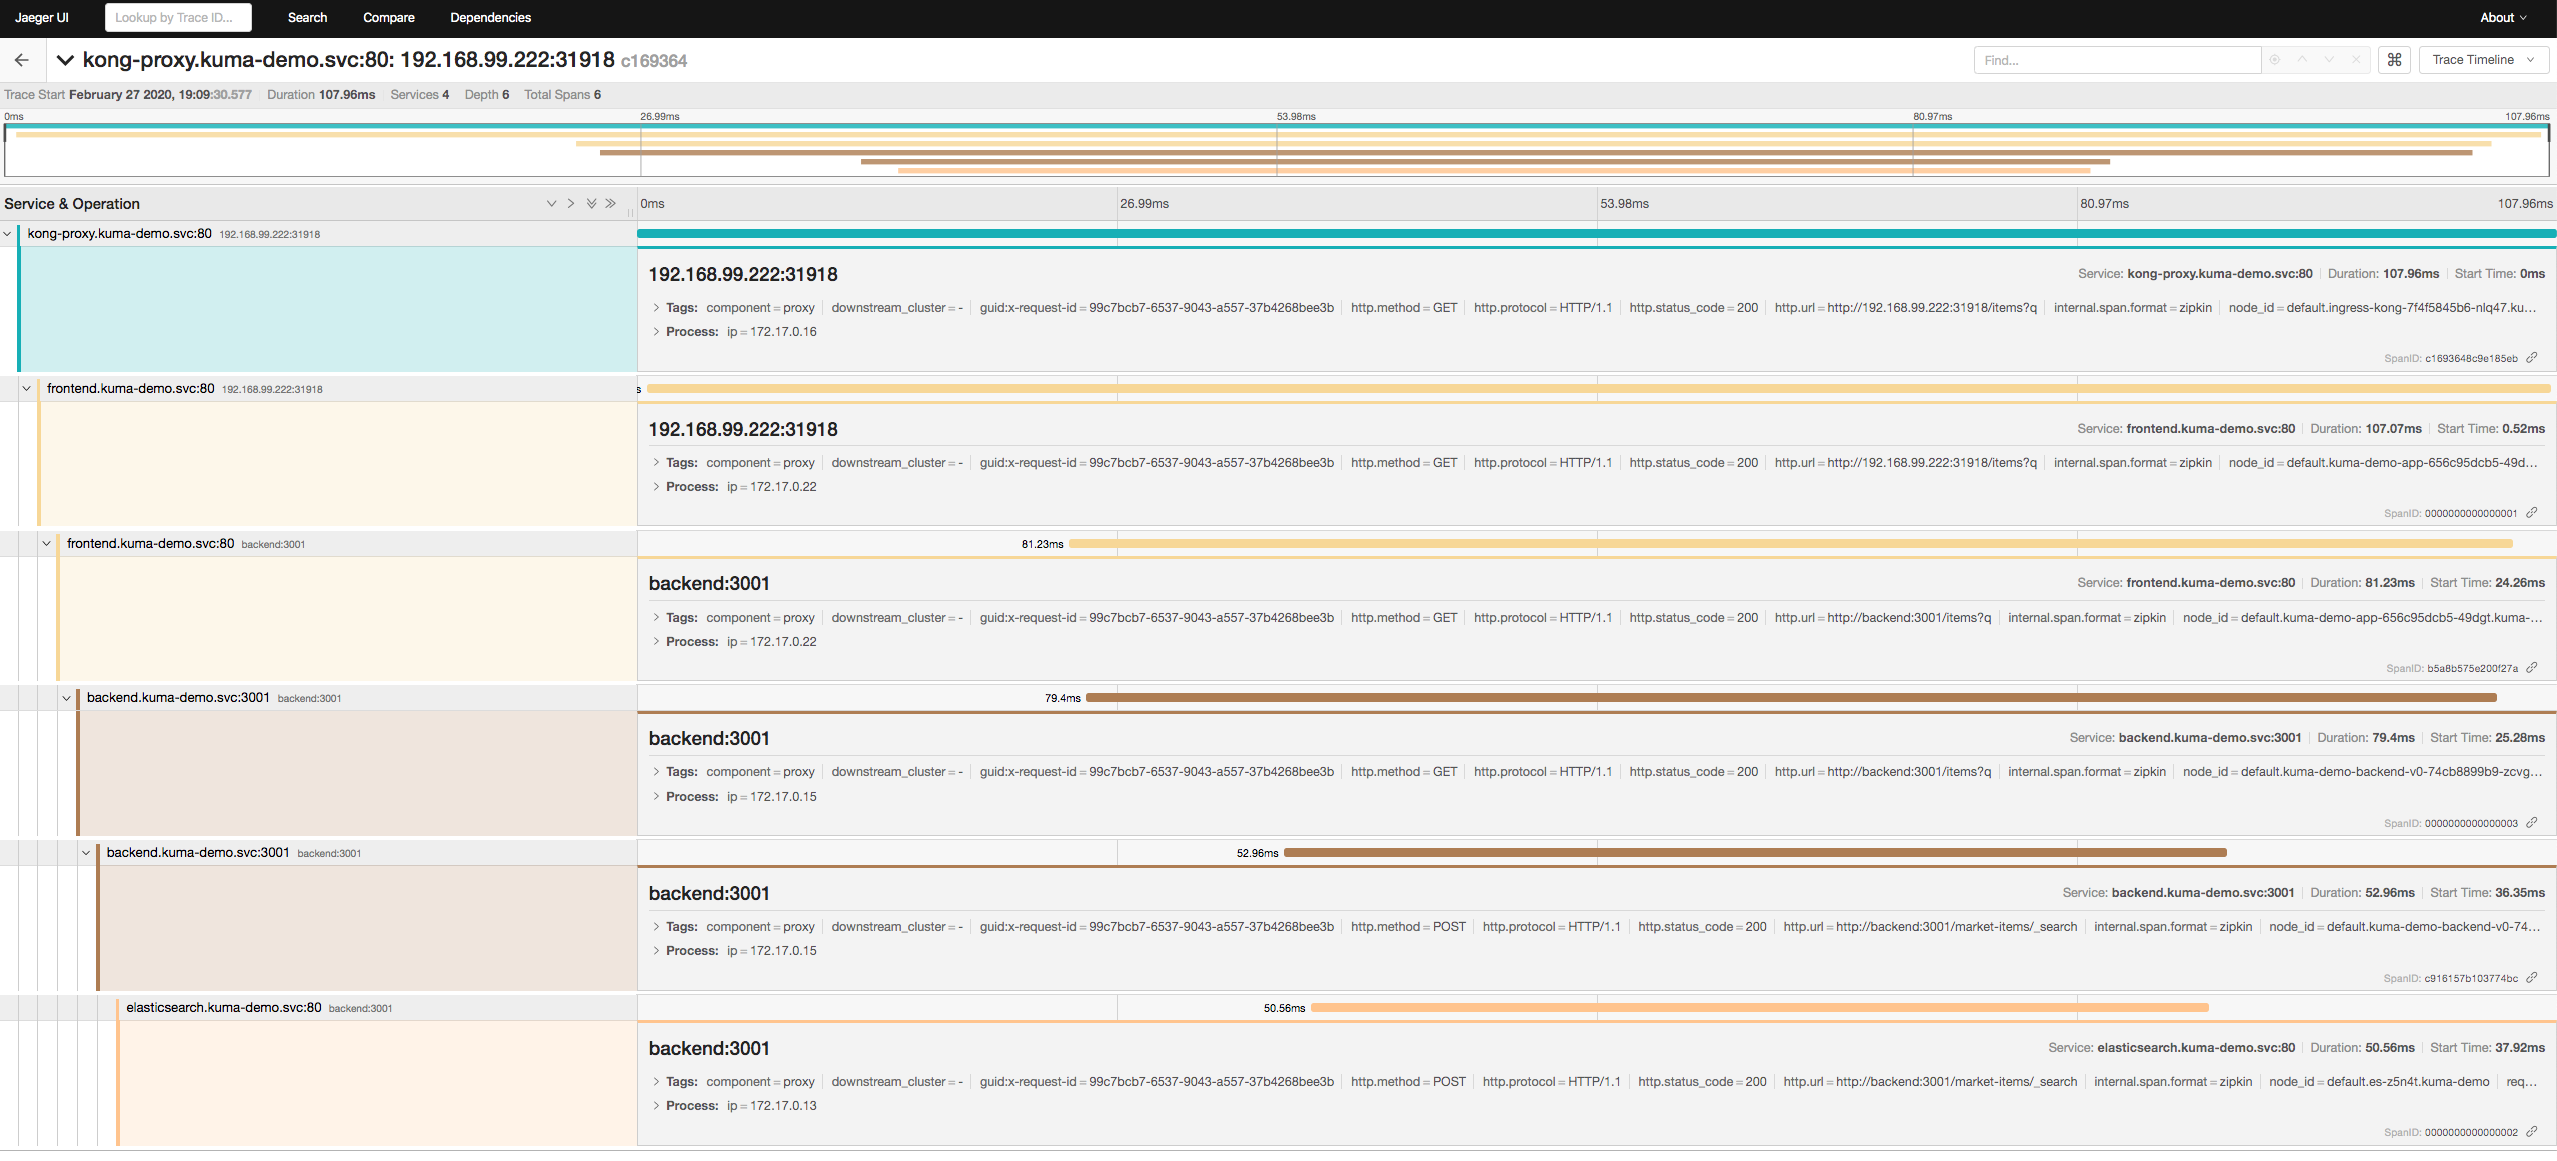
Kuma now supports L7 tracing with configurable tracing backends by leveraging the new TrafficTrace policy. It supports Zipkin and Jaeger out of the box, and it allows to better identify the flow of traffic among our services in order to identify dependencies and bottlenecks in our systems.
Below you can see a Jaeger example after being integrated with Kuma:
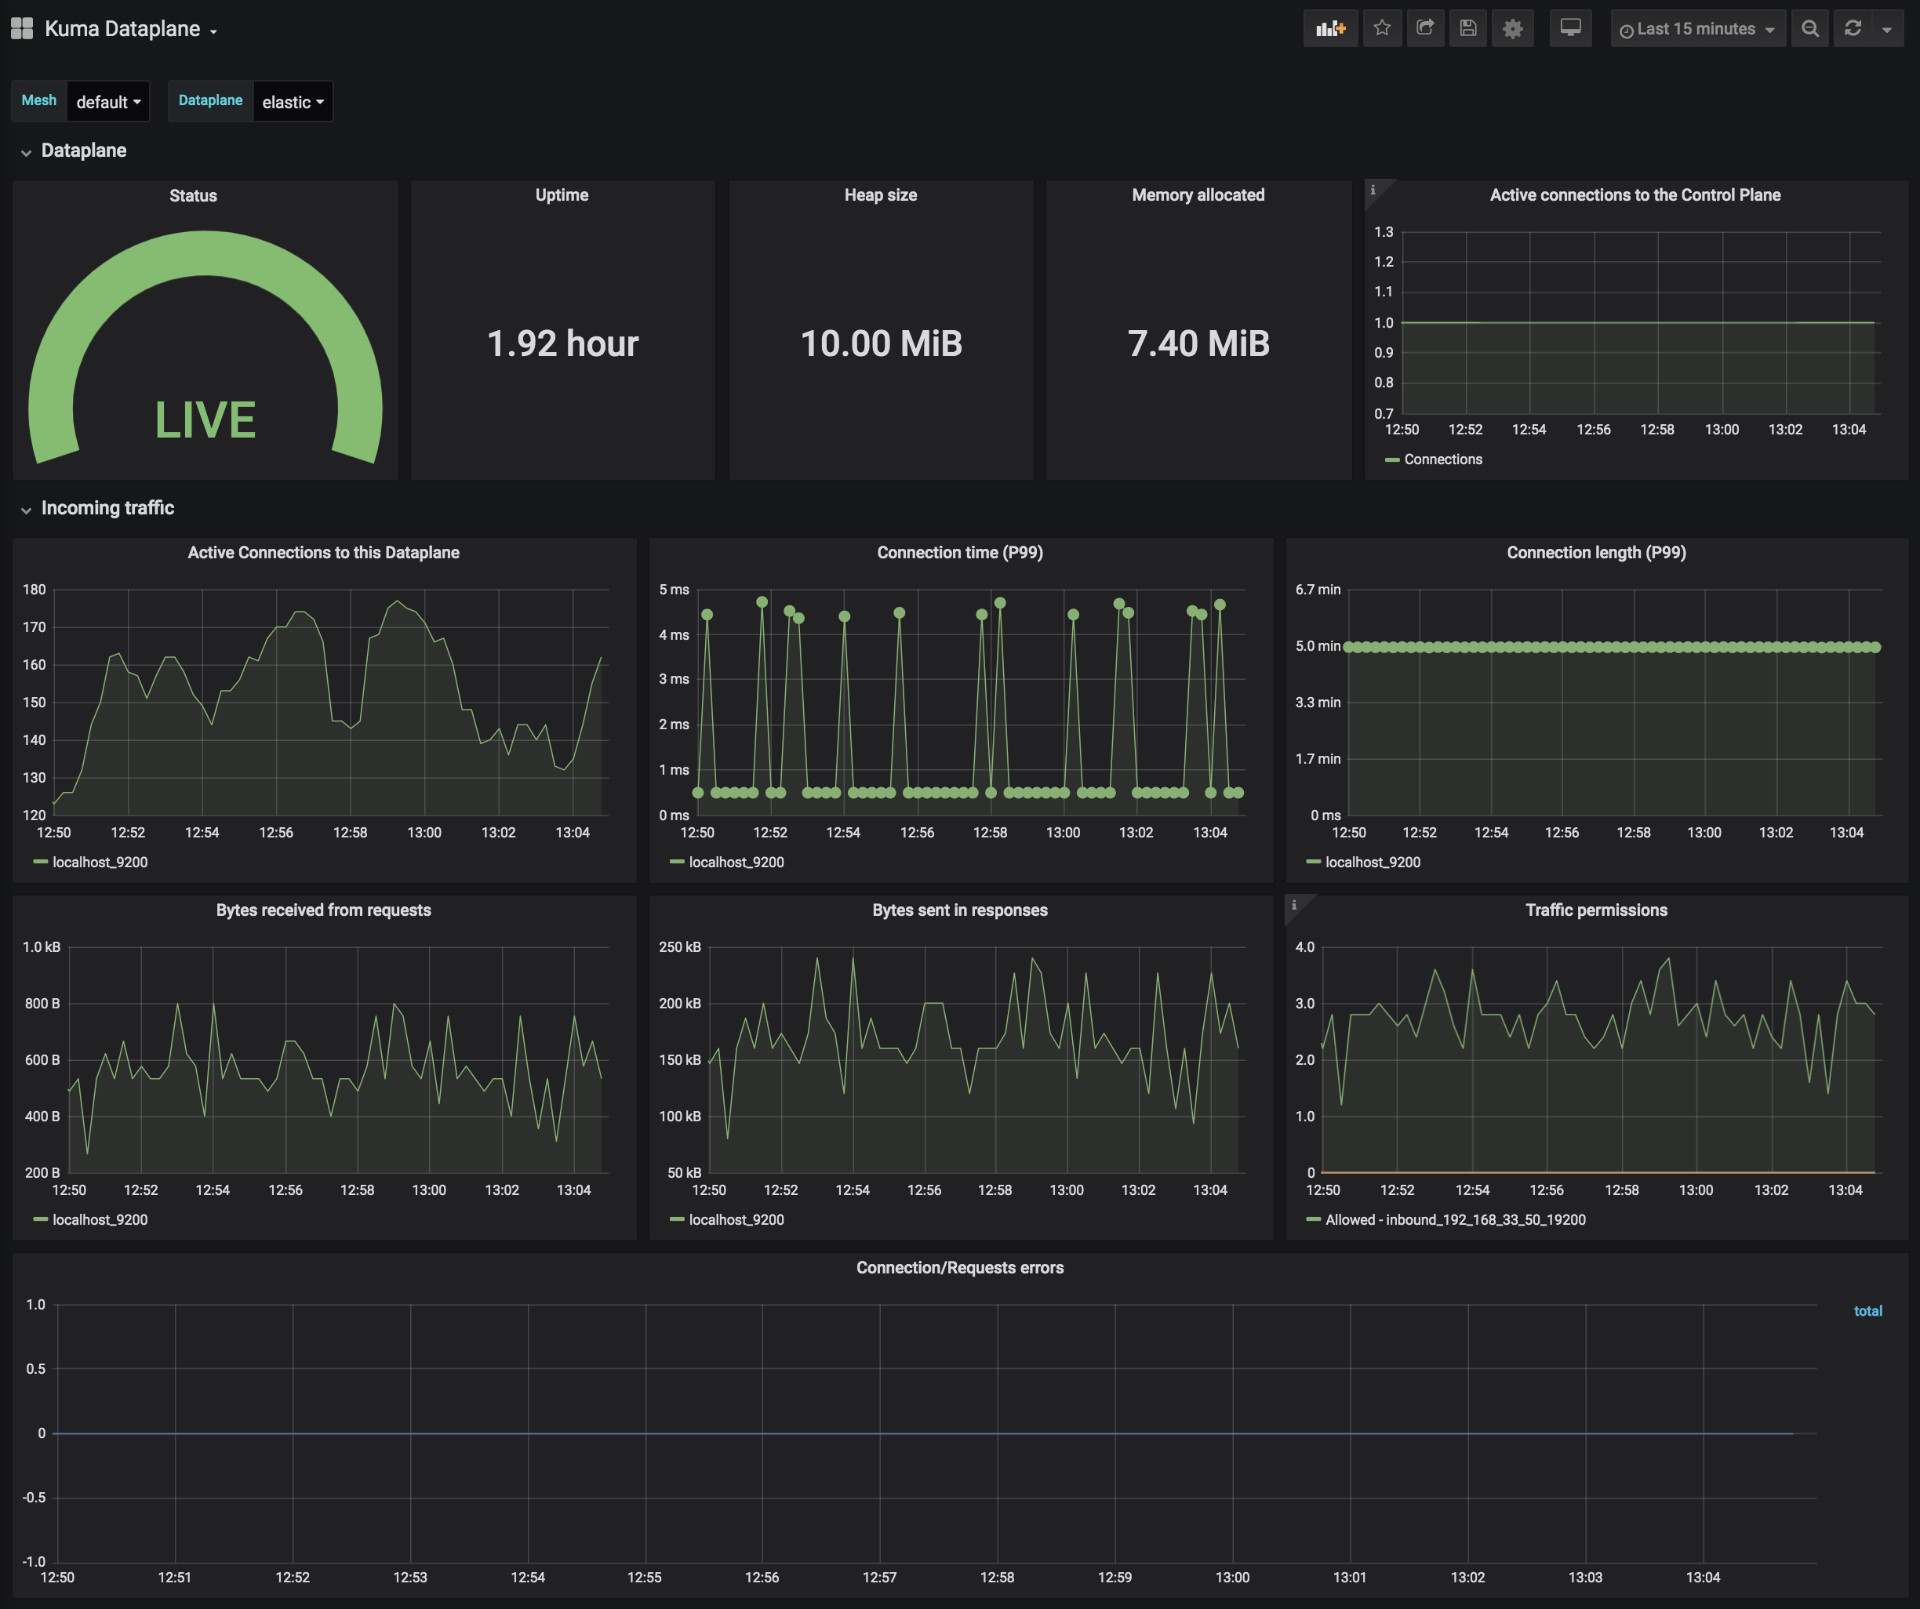
Kuma already allowed the collection of metrics via the TrafficMetric, and now it supports three new official Grafana dashboards that - out of the box - allow to visualize vital metrics about the Service Mesh. The dashboards provide:
- Metrics for a single Dataplane.
- Metrics for a single Mesh.
- Metrics for the service traffic in a Mesh.
You can find the dashboards in the Grafana marketplace. Below, you see an example:
As we keep adding more and more features in Kuma and work with the broader community, don't forget to check out the Community resources including a real-time Slack chat to get an answer to any question you may have when using Kuma.
Kuma's goal is to create a simple, portable and feature-rich Service Mesh that everybody can use in minutes across any system. Contributions are welcomed to get one step closer to this vision on every new release.
Be sure to carefully read the Upgrade Guide, as this new version introduces a few important changes.

