This is a sample script for correctly exporting the charts on Google Spreadsheet as the images using Google Apps Script. In the current stage, using Google Apps Script, when the charts on Google Spreadsheet are exported as the images, it seems that the exported images are not the same with the original one on Google Spreadsheet. About this, today, I could notice that I had answered for 2 questions. Q1, Q2 And also, I had already been reported this at the issue tracker. Ref
In this post, as the current workaround, I would like to introduce the method for exporting the chart on Google Spreadsheet as the same images with the original one.
As a sample situation, the following chart is used.
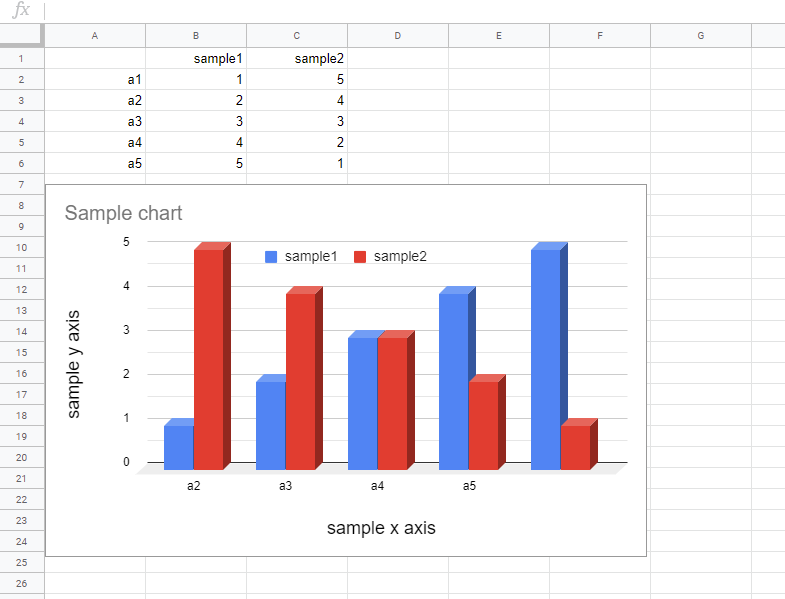
When above chart is exported as an image using the following script.
const chart = SpreadsheetApp.getActiveSheet().getCharts()[0];
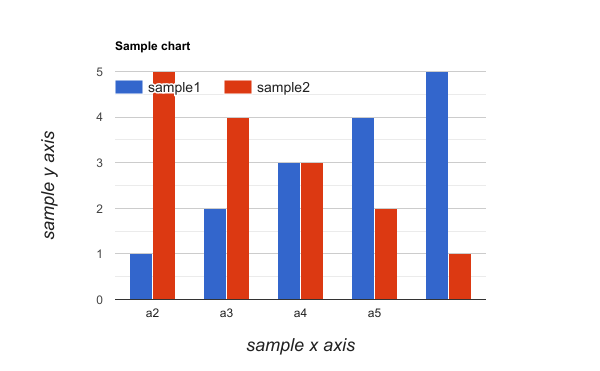
DriveApp.createFile(chart.getBlob().setName("sample.png"));The following image is retrieved. In this case, it is found that the exported image is NOT the same with the original one.
I think that this might be the bug or the current specification. So as a workaround, Google Slides is used as the temporal file. When a chart on Google Spreadsheet is inserted to Google Slides, the chart object can be directly used. And, when the blob is retrieved from the chart inserted to Google Slides, the correct image can be retrieved. So I used this method as a workaround. The sample script is as follows.
const chart = SpreadsheetApp.getActiveSheet().getCharts()[0];
const slides = SlidesApp.create("temp");
const imageBlob = slides
.getSlides()[0]
.insertSheetsChartAsImage(chart)
.getAs("image/png");
DriveApp.getFileById(slides.getId()).setTrashed(true);
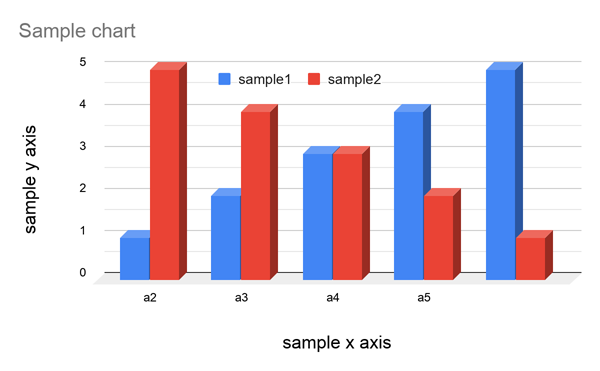
DriveApp.createFile(imageBlob.setName("sample.png"));When this script is run, the following image is retrieved. In this case, it is found that the exported image is the same with the original one. By the way, when the chart is manually exported as an image, the image is the same with the original one. it seems that only when the script is used, this issue occurs.
I believe that this bug or the current specification will be resolved in the future update. So until this issue was resolved, I would like to use the above workaround for exporting the chart using a script.
check for the chart option "theme" and its value "maximize", that's why legends and titles are overlapped 🤙