This sample script embeds a chart to a cell using custom function on Spreadsheet.
I think that this method is one of various ideas.
When you want to create a chart and embed it to a cell using custom functions, you notice that insertChart() cannot be used. There are some limitations for using custom functions. But insertChart() creates floating charts. So in order to embed a chart to a cell, the function =IMAGE() is suitable for this situation. Here, setFormula() for setting =IMAGE() and DriveApp.createFile() for creating images from charts also cannot be used for custom functions.
In order to avoid these limitations, I used Web Apps. From previous research, it has been found that Web Apps can avoid various limitations. Also in the case of this situation, Web Apps could avoid the above limitations.
To use this sample script, please deploy Web Apps as follows.
On the Script Editor,
- File
- -> Manage Versions
- -> Save New Version
- Publish
- -> Deploy as Web App
- -> At Execute the app as, select "your account"
- -> At Who has access to the app, select "Anyone, even anonymous"
- -> Click "Deploy"
- -> Copy "Current web app URL"
- -> Click "OK"
When it deploys Web Apps, the approval required authorization can be done, simultaneously.
Please copy and paste this script to a bound script of spreadsheet.
var folderId = "### Folder ID ###";
var webappsurl = "https://script.google.com/macros/s/######/exec";

function embedChart(range) {
  var ac = SpreadsheetApp.getActiveSheet().getActiveCell();
  var q1 = "?datarange=" + range;
  var q2 = "&row=" + ac.getRow();
  var q3 = "&col=" + ac.getColumn();
  var url = webappsurl + q1 + q2 + q3;
  UrlFetchApp.fetch(url);
}

function doGet(e) {
  var sheet = SpreadsheetApp.getActiveSheet();
  var chart = sheet.newChart()
    .setChartType(Charts.ChartType.PIE)
    .addRange(sheet.getRange(e.parameters.datarange))
    .setOption('height', 280)
    .setOption('width', 480)
    .setOption('title', 'Sample chart')
    .build();
  var file = DriveApp.getFolderById(folderId).createFile(
    chart.getAs('image/png').setName("chart_image.png")
  );
  file.setSharing(DriveApp.Access.ANYONE_WITH_LINK, DriveApp.Permission.VIEW);
  sheet.getRange(e.parameters.row, e.parameters.col).setFormula(
    '=IMAGE("' + "http://drive.google.com/uc?id=" + file.getId() + '")'
  );
}embedChart()
- Input
=embedChart("a2:a6")in cellB7. - Using
fetch(), sends data ofa2:a6and the inputted coordinate todoGet().
doGet()
- Using
doGet(), get the data. - Creates a chart using inputted range
a2:a6. (in this case, creates a pie chart) - Saves a chart as an image. (in this case, saves as PNG)
- Updates a permission of the image file to use for
=IMAGE(). - Embeds the image using
=IMAGE()which was imported bysetFormula().
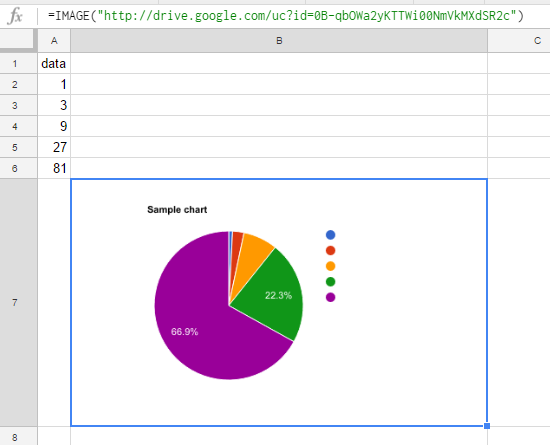
By inputting =embedChart("a2:a6") in cell B7 as a custom function, following result can be obtained.
- When the custom function
embedChart()is used, loading time is about 40 seconds. (I don't know whether this occurs only my environment.) - Permissions of the created image are ANYONE_WITH_LINK, VIEW.
embedChart()is overwritten by=IMAGE(). So when the spreadsheet is reopened, the response of=IMAGE()is much faster than that ofembedChart().