Benchmark: Measuring Process Costs for Formulas in Cells on Google Spreadsheet using Google Apps Script
When Google Spreadsheet is used, there is the case that the built-in functions and the custom functions in the cells are used. For the functions of Google Apps Script, there is the method for measuring the process cost. Ref But for the built-in functions, it is required to create the script for it. In this report, the script for measuring a function put in a cell has been proposed, and the process cost of the built-in functions has been measured. The proposed script can measure the process cost for the built-in functions and custom functions on Google Spreadsheet. The script is created with using Google Apps Script. When the process cost can be known for the built-in functions and custom functions, it is considered that it will be useful for the developers using Google Spreadsheet.
The origin of this method is my answer of this thread.
This is a simple sample script for measuring the process cost of functions on a cell. At first, in order to confirm whether this script can be used for measuring the process cost of the function put in a cell, a custom function was used. Because when the custom function is used, the process time of the script can be known by using Utilities.sleep(time).
When you test this script, please copy and paste the following script to the container-bound script of Google Spreadsheet. When you run the function of main(), the process cost of =SAMPLE(5000) can be obtained.
// This is a sample custom formula. This is used for testing.
function SAMPLE(time) {
  Utilities.sleep(time);
  return "ok";
}

// This is a script for measuring the process cost.
function main() {
  const obj = { formula: `=SAMPLE(5000)`, returnValue: "ok" }; // Set formula and response value.

  const label = "Execution time";
  const sheet = SpreadsheetApp.getActiveSpreadsheet().getSheetByName("Sheet1");
  const range = sheet.getRange("A1");
  range.clear();

  // start --- measure
  console.time(label);
  range.setFormula(obj.formula);
  SpreadsheetApp.flush();
  while (range.getDisplayValue() != obj.returnValue) {}
  console.timeEnd(label);
  // end --- measure

  range.clear();
}- In this sample, when
=SAMPLE(5000)is put to a cell, the value ofokis shown in the cell after 5 seconds.main()measures the process time for this. - This sample script checks the output value from the function. So please set
returnValue. Please be careful this. - At the formula of Spreadsheet, when the formula is put to the cell, the measurement of process time is started. So I included
setFormulaandflushto the measured process cost. Because the detail process ofsetFormulaandflushin the internal server are not cleared.
In this section, the measurement result of the process costs for the custom functions is discussed.
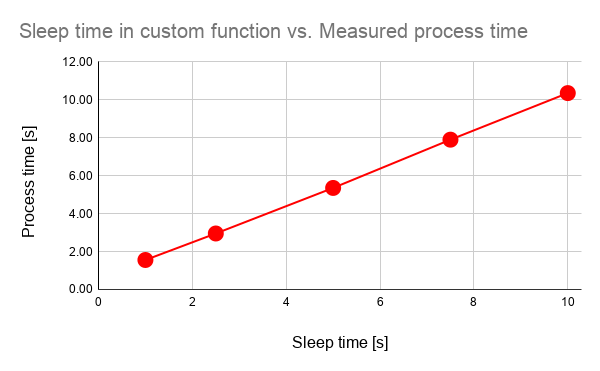
Fig. 1. Sleep time in custom function vs. process cost.
As an experiment, it shows the change of process time with increasing the sleep time of the custom function as Fig. 1. This result indicates that the process time is linearly increased with the increase in the sleep time. It was found that the process time was at least, more than the sleep time, and the process time was large in about 0.5 s for each sleep time as the offset. It is considered that this offset includes the process costs of setFormula, flush, getDisplayValue and the while loop. But, from Fig. 1, it is considered that when the process costs of various formulas are measured using above script, those can be compared by the relative comparison. And from this result, it is considered that above script can be used for measuring the process time of the function in a cell of Spreadsheet, and also, this method can be used for measuring the process cost for not only te custom function, but also, the built-in functions.
As the next step, the process costs of the built-in functions are measured.
In this section, using the script proposed at the section 1, the measurement result of the process costs for the built-in functions is discussed. In this experiment, the process cost for retrieving bb2 from aa1,bb2,cc3 put in a cell was measured. The input sheet is as shown in Fig. 2.
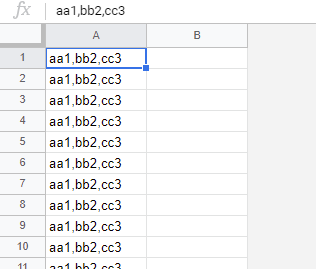
Fig. 2. Spreadsheet for measuring process cost.
When the process cost is measured, the formula is put to the cell "B1". When the result is retrieved, the process time is retrieved. This flow is achieved using the script proposed at the section 1. In this experiment, the result values are retrieved from the all cells using ARRAYFORMULA by putting a formula to the cell "B1". When ARRAYFORMULA is used, when no error occurs, it was found that the result values are shown in the cells after all rows were done. So in this measurement, the cell "B1" was checked for finishing the formula using the above script.
As the sample formulas for measuring the process costs, the following formulas are used. Each formula is put to the cell "B1" and all formulas show the same result which is bb2.
- REGEXREPLACE:
=ARRAYFORMULA(REGEXREPLACE(A1:A,".+?,(.+?),.+","$1")) - REGEXEXTRACT:
=ARRAYFORMULA(REGEXEXTRACT(A1:A,".+?,(.+?),.+")) - SPLIT and INDEX:
=ARRAYFORMULA(INDEX(SPLIT(A1:A,","),,2)) - SPLIT and QUERY:
=ARRAYFORMULA(QUERY(SPLIT(A1:A,","),"SELECT Col2"))
The measured process costs are shown in Fig. 3. The process costs were measured by changing the number of rows.
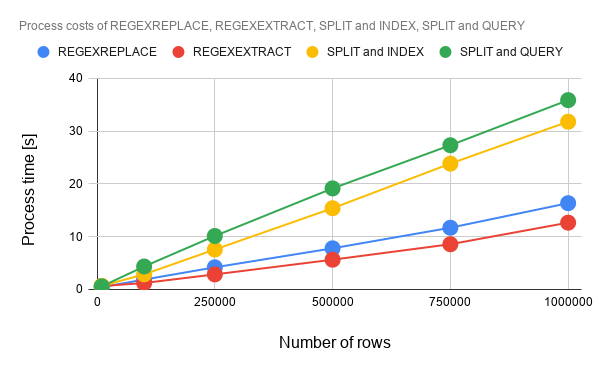
Fig. 3. Process costs of REGEXREPLACE, REGEXEXTRACT, SPLIT and INDEX, SPLIT and QUERY.
From Fig. 3, it was found that the process costs of all formulas were almost linearly increasing with the increase in the number of rows. The process costs were REGEXEXTRACT, REGEXREPLACE, SPLIT and INDEX, SPLIT and QUERY in the ascending order. It was found that in above experimental condition, the process cost of REGEXEXTRACT was lowest of all. And also, the process costs of REGEXEXTRACT, REGEXREPLACE are lower than those of SPLIT and INDEX, SPLIT and QUERY. These are very interesting result. When the process costs of SPLIT and INDEX, SPLIT and QUERY are seen, it was found that when the array element is retrieved from an array, the process cost of INDEX is lower than that of QUERY. Also, it was found that REGEXEXTRACT can reduce the process cost with 56 % for SPLIT and QUERY.
In this report, I proposed the script for measuring the process cost of the function put in a cell (the built-in functions the custom functions) for Google Spreadsheet. As the result, the following results were obtained.
- Proposal script could be used for measuring the process cost of the function in a cell.
- At the experiment for retrieving
bb2fromaa1,bb2,cc3in a cell, the process costs were REGEXEXTRACT, REGEXREPLACE, SPLIT and INDEX, SPLIT and QUERY in the ascending order. - Process cost of REGEXEXTRACT was lowest of REGEXREPLACE, REGEXEXTRACT, SPLIT and INDEX, SPLIT and QUERY.
- Process costs of REGEXEXTRACT, REGEXREPLACE are lower than those of SPLIT and INDEX, SPLIT and QUERY.
- REGEXEXTRACT can reduce the process cost with 56 % for SPLIT and QUERY.
- When the process costs of SPLIT and INDEX, SPLIT and QUERY are seen, it was found that when the array element is retrieved from an array, the process cost of INDEX is lower than that of QUERY.
-
As other situation of function, when
ARRAYFORMULAis used, it seems that the result values are shown in the cells after all rows were done. When this is used, it is considered that the process time usingARRAYFORMULAcan be measured by checking one cell. -
In above script, even when
while (range.getDisplayValue() != obj.returnValue){}is replaced torange.getDisplayValue(), the same result can be obtained. And also, even whenSpreadsheetApp.flush()andwhile (range.getDisplayValue() != obj.returnValue){}are replaced torange.getDisplayValue(), the same result can be obtained. From these situation, I thought that in the case that the formula is put usingsetFormulaand the cell value is retrieved bygetValueandgetDisplayValue, the value might be able to be retrieved when the calculation of the formula was done.- But when the process costs are measured using the same script, those can be compared by the relative comparison. Please be careful this.
-
Also, I have to describe that this is the result for Google Apps Script. The process cost of this report might be modified by future update of Google.
Dear @tanaikech !
Thank you very much! You've inspired me to create my own solution:
https://stackoverflow.com/a/74443574/5372400
As I'm not a scientist, I would like to know your opinion about my solution. I would be great if you could make it better.