Happy New Year to everyone! Given the start of the New Year (and the beginning of my preparation for my Finals), I thought it would be apt to start a mini-series on... Demography! With all the confusion that's been going on in the world in the last year, maybe it would be good to try to understand people better. Which, Demography (defined as "the study of human populations in relation to the changes brought about by the interplay of births, deaths, and migration" (Pressat, 1985)) prompt fulfills. This will likely be a 4 part series, looking at 2 demographic measures per part. Each part will look at the theoretical concepts behind the measure and then explore using Python to easily calculate it. So... Let's dive right in!
Three key theoretical points about population growth rates before we dive into calculations.
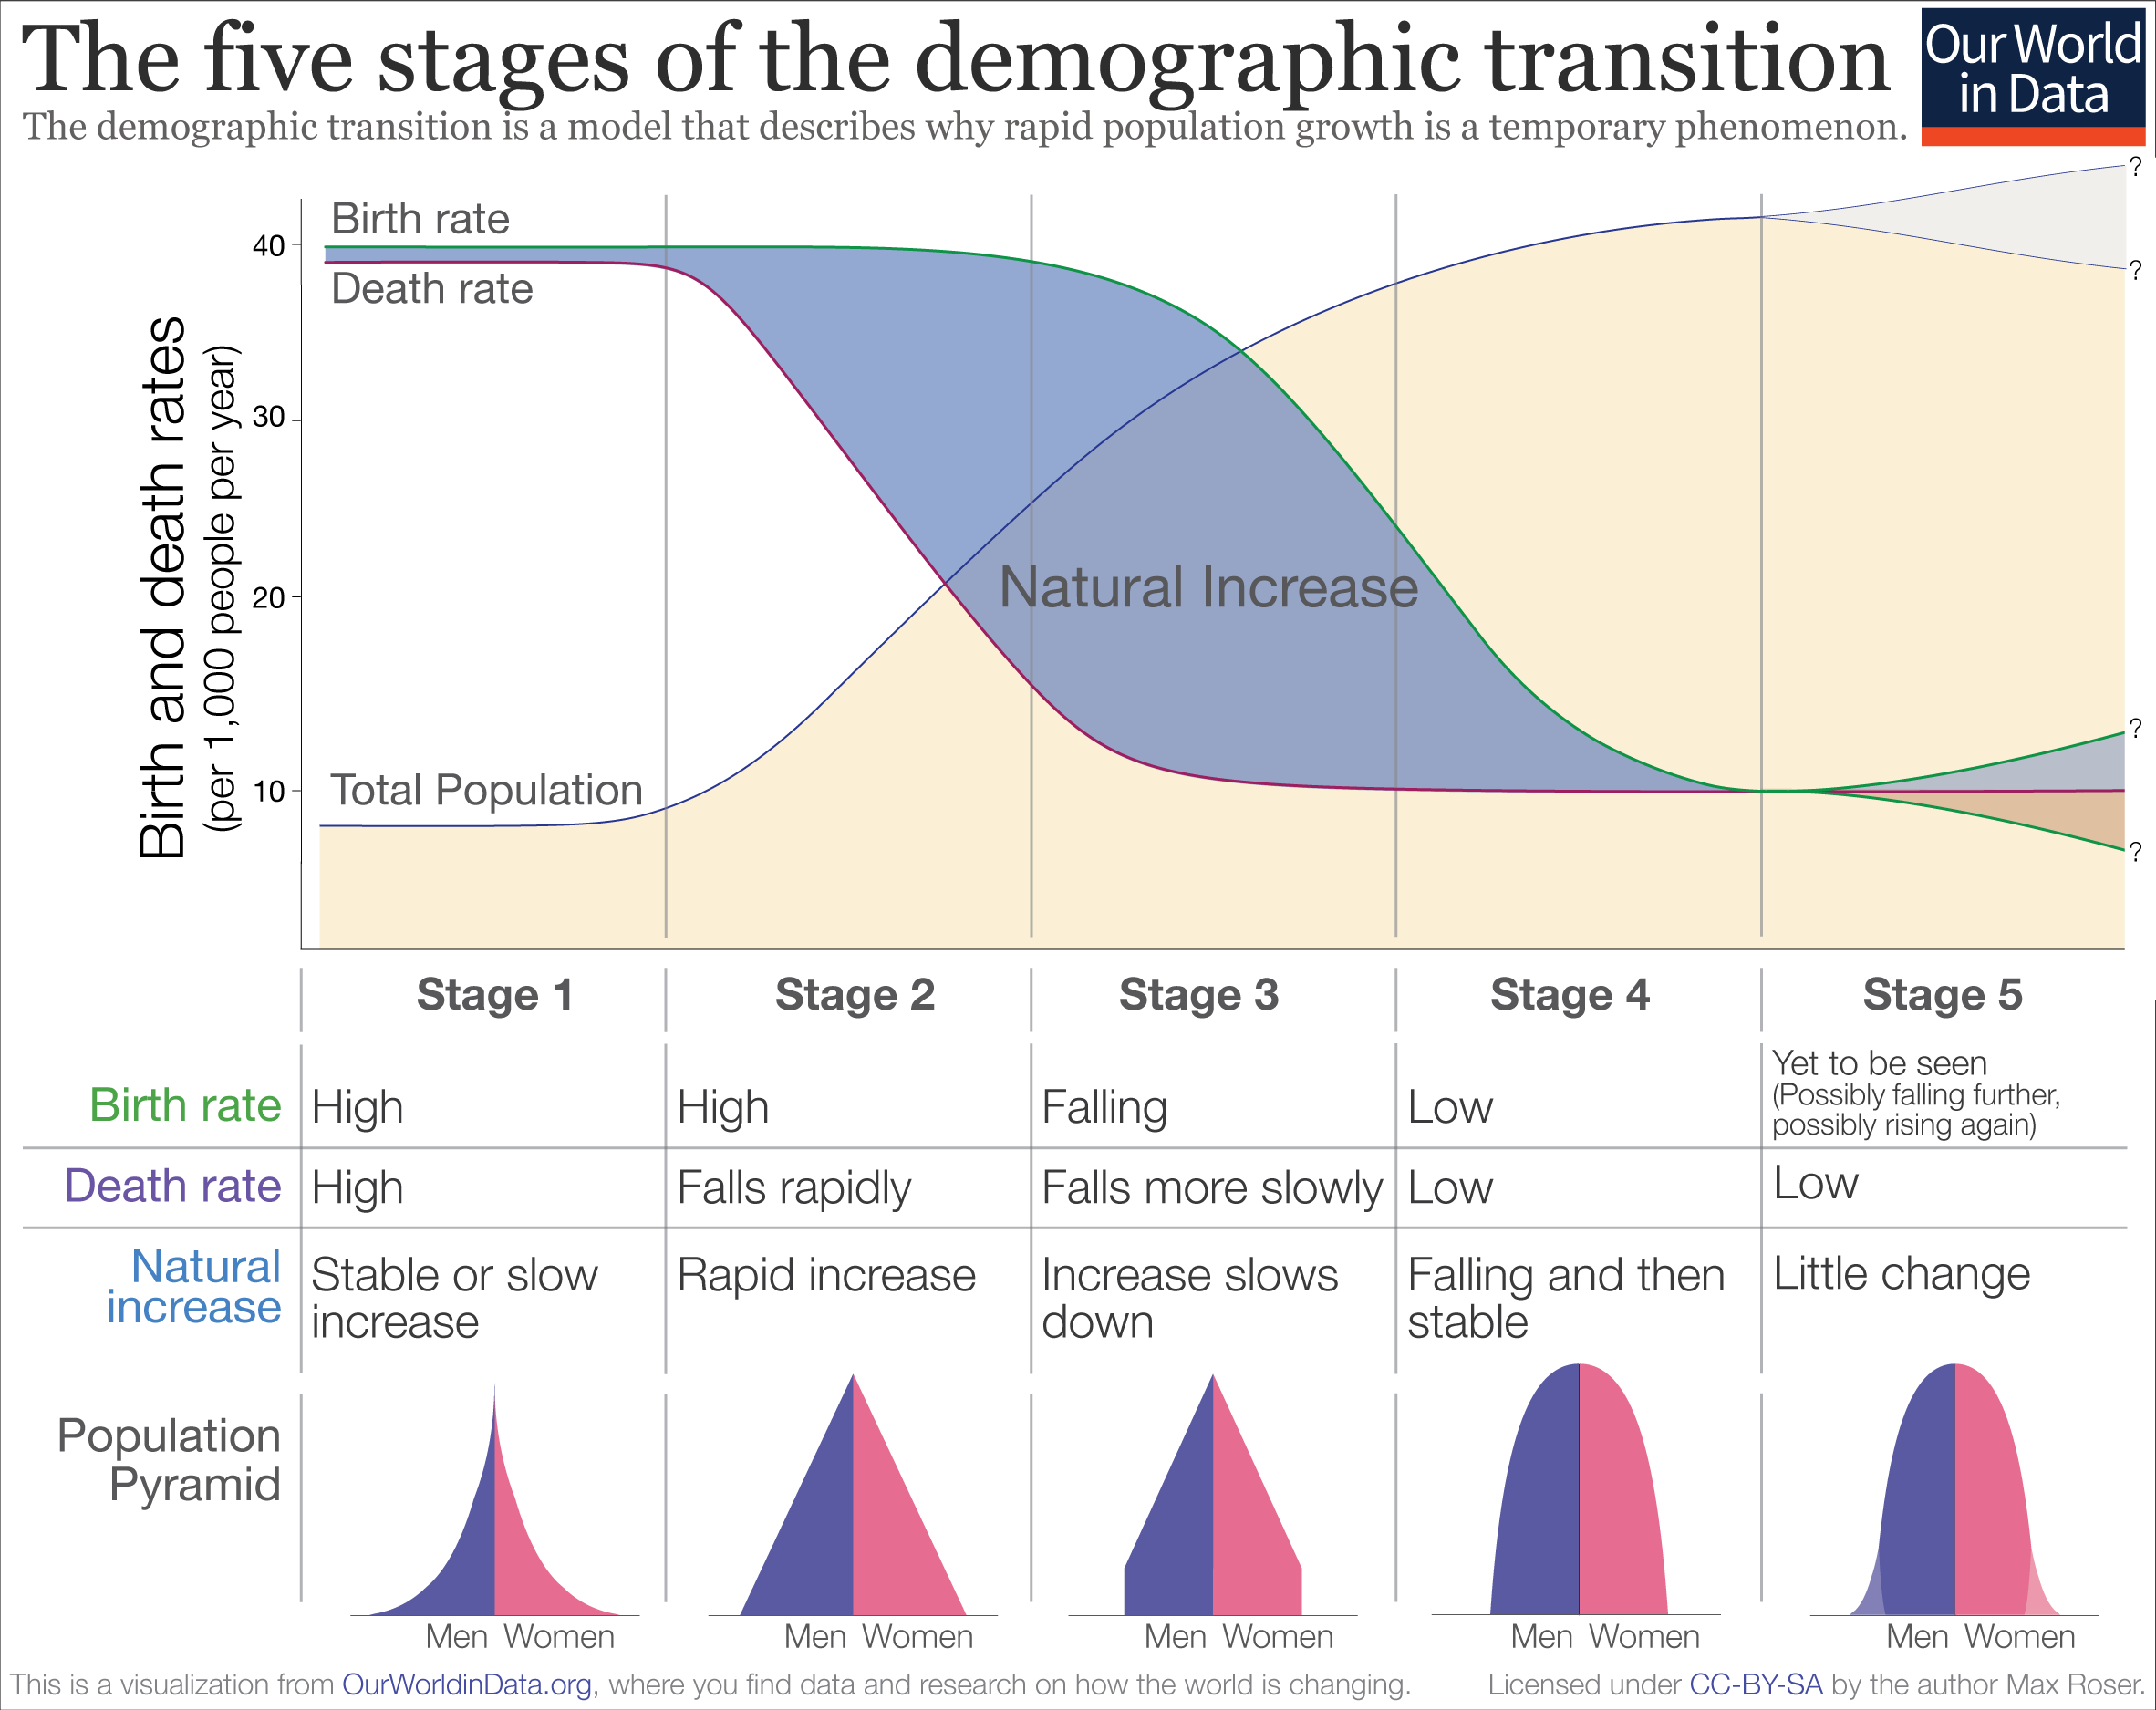
- For the longest period of time, the world population did not actually grow that much. One of the hypothesis for this was the Malthusian theory of "preventive checks" (delays in marriage) and "positive checks" (war, famine, epidemics). This resulted in homeostasis since the size of the population and its growth had to be compatible with the availability of resource.
- But then, the demographic transition took place, with death rates falling rapidly due to improvements in healthcare and sanitation. This allowed R (the growth rate) to increase.
- This transition takes different pathways in different countries and contexts but always has significant implications on the population structure and growth. The following graph shows an example of the demographic transition (Stage 2). You can find more of such graphs and resources here! Lots of good stuff available on Demography at that link.
In order to calculate the change in a population, we use the following equation:
K(t+n) =K(t) + B(t,t+n) − D(t,t+n) + I(t,t+n) − E(t,t+n)
where t is the current time and n is how many years later we are projecting forward. B is births, D is deaths, I is immigration, and E is emigration. K(t) is the original size of the population so this is intuitive enough
Since population growth is a multiplicative process, we can find K(1) by taking K(0) (the previous time period) and multiply that by (1 + B/K - D/K). Here, we take the ratios of births over population minus deaths over population. In Demography, we call this A. So, simplified:
K(T) = K(0) x AT
where K(T) is the population at any time period and K(0) is the current time period. A assumes a constant birth and death rate. Let's plot this out shall we?
https://gist.github.com/4ca29695001587dabcb629c50c137d59
https://gist.github.com/bb641b2cca0f554040e8374aea8a12a0
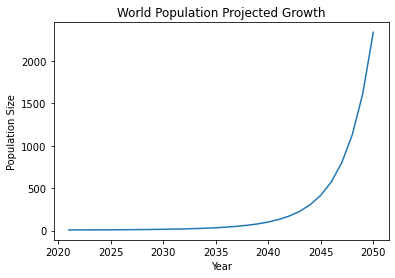
We see that population growth is exponential. What can we do with this? Well, in order to get R (the growth rate), we need to take ln(A). This gives us the following equation:
ln(K(t)) = ln(K(0)) + R*T
This is the final equation to find the growth rate and this can be used in many useful ways. For instance, we could find the doubling time - the time it takes for a population to double, assuming a constant growth rate.
https://gist.github.com/c7db638e216b7434fee565f7ecffa426
55.90 years
The theory behind this measure was much simpler. Essentially, we need to calculate death rates since these are essential rates in looking at population growth. There are 2 types of death rates - crude and standardized. Crude rates are so called because:
- They don't account for variation in ages of occurrence. For instance, the occurrence of death is typically higher at older ages than younger ages.
- Age is an example of a confounding factor and these need to be taken into account before one can compare populations.
In order to compare populations, one has to thus use age-specific rates and standardize the populations. To standardize a population, we assume that population A has the same age structure as population and coerce it to be so.
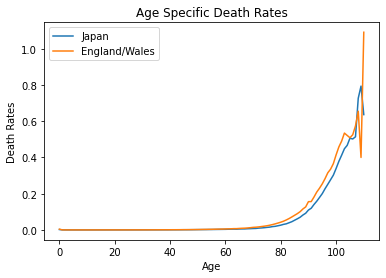
Calculating the age specific death rates really isn't that difficult. The first method was to basically replicate what one would do in excel and create all the individual columns for the rates before summing it up. This could potentially be useful if one wanted to graph out some of the data. I show this on a sample dataset comparing Japan and England/Wales.
https://gist.github.com/c9fd894ea959c720340d0d548b137d79
Japan Standardized Death Rate: 0.00741
England/Wales Standardized Death Rate: 0.01090
https://gist.github.com/3b61bbe1ce741282bdfc5438479a7bc4
Alternatively, one could combine everything into one big messy chunk of code like so. Both would return the same results except that one would be slightly more efficient.
https://gist.github.com/78c9be9992cdaee8af7486ec6aeda577
Japan Standardized Death Rate: 0.00741
England/Wales Standardized Death Rate: 0.01090
That's the end of part 1 where we looked at simple measures of population growth and standardized death rates! In part 2, we'll take a look at mortality rates as well as period vs cohort measures! Thanks for reading :)