Skip to content

Instantly share code, notes, and snippets.

@ceejbot
Last active November 15, 2022 08:53
Show Gist options
  • Save ceejbot/032e545a9f2aebee7cc6 to your computer and use it in GitHub Desktop.
Save ceejbot/032e545a9f2aebee7cc6 to your computer and use it in GitHub Desktop.
monitoring manifesto

monitoring: what I want

I've recently shifted from a straight engineering job to a job with a "dev/ops" title. What I have discovered in operations land depresses me. The shoemaker's children are going unshod. Operations software is terrible.

What's driving me craziest right now is my monitoring system.

what I have right now

What I have right now is Nagios.

Nagios in action

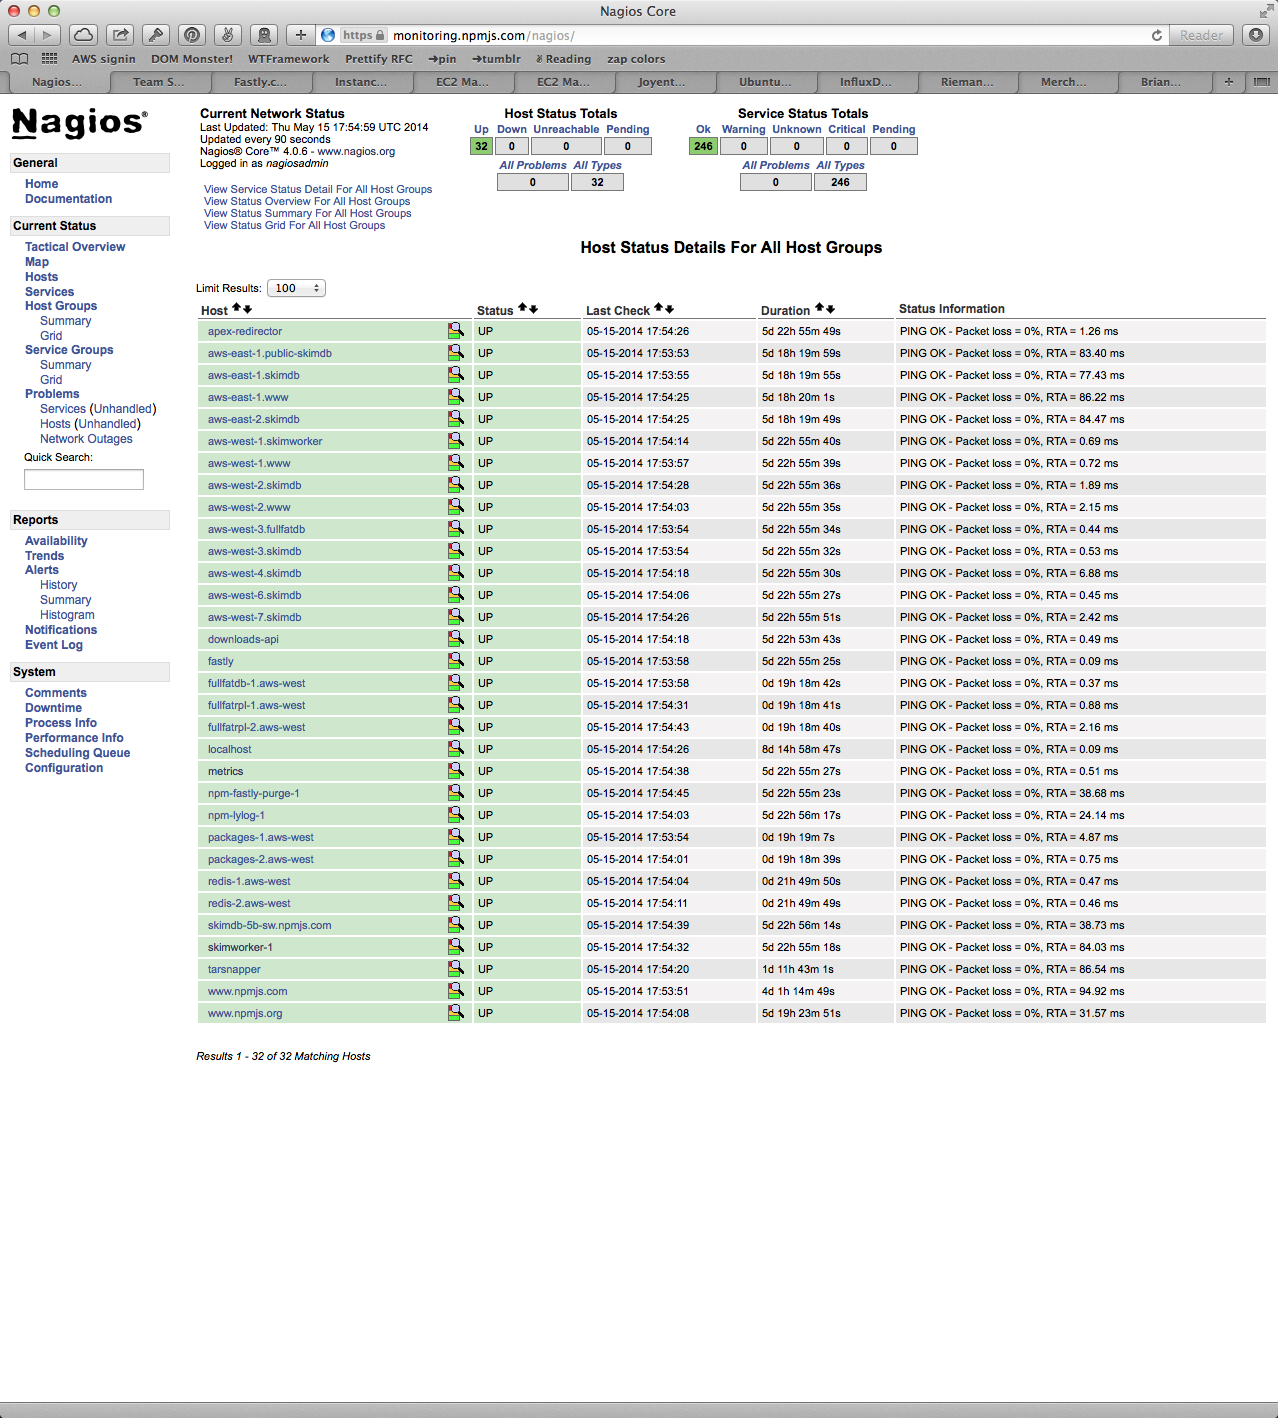
This display is intended to tell me if the npm service is running well.

Nagios works like this: You edit its giant masses of config files, adding hosts and checks manually. A check is an external program that runs & emits some text & an exit status code. Nagios uses the status code as a signal for whether the check was ok, warning, critical, or unknown. Checks can be associated with any number of hosts or host groups using the bizarre config language. Nagios polls these check scripts at configurable intervals. It reports the result of the last check to you next to each host.

  • The checks do all the work.
  • The latency is horrible, because Nagios polls instead of receiving updates when conditions change.
  • The configuration is horrible, complex, and difficult to understand.
  • Nagios's information design is beyond horrible and into the realm of pure eldritch madness.

This. This is the state of the art. Really? Really?

Nagios is backwards. It's the wrong answer to the wrong question.

Let's stop thinking about Nagios.

what is the question?

Are my users able to use my service happily right now?

Secondary questions:

Are any problems looming?
Do I need to adjust some specific resource in response to changing needs?
Something just broke. What? Why?

how do you answer that?

  • Collect data from all your servers.
  • Interpret the data automatically just enough to trigger notifications to get humans to look at it.
  • Display that data somehow so that humans can interpret it at a glance.
  • Allow humans to dig deeply into the current and the historical data if they want to.
  • Allow humans to modify the machine interpretations when needed.

From this we get our first principle: Monitoring is inseparable from metrics.

our principles

Everything you want to monitor should be a datapoint in a time series stream (later stored in db). These datapoints should drive alerting inside the monitoring system. Alerting should be separated from data collection-- a "check" only reports data!

Store metrics data! the history is important for understanding the present & predicting the future

Checks are separate from alerts. Use the word "emitters" instead: data emitters send data to the collection system. The collection service stores (if desired) and forwards data to the real-time monitoring/alerting service. The alerting service shows current status & decides the meaning of incoming data: within bounds? out of bounds? alert? Historical analysis of data/trends/patterns is a separate service that draws on the permanent storage.

base requirements

  • Monitored things should push their data to the collection system, not be polled.
  • Current state of the system should be available in a single view.
  • Out-of-bounds behavior must trigger alerts.
  • The alerting must integrate with services like PagerDuty.
  • Data must be stored for historical analysis.
  • It must be straightforward to add new kinds of incoming data.
  • It must be straightforward to add/change alert criteria.

tools of interest

Another principle: build as little of this as possible myself.

  • Consul: service discovery + zookeeper-not-in-java + health checking. See this description of how it compares to Nagios.

Consul looks like this:

Consul in action

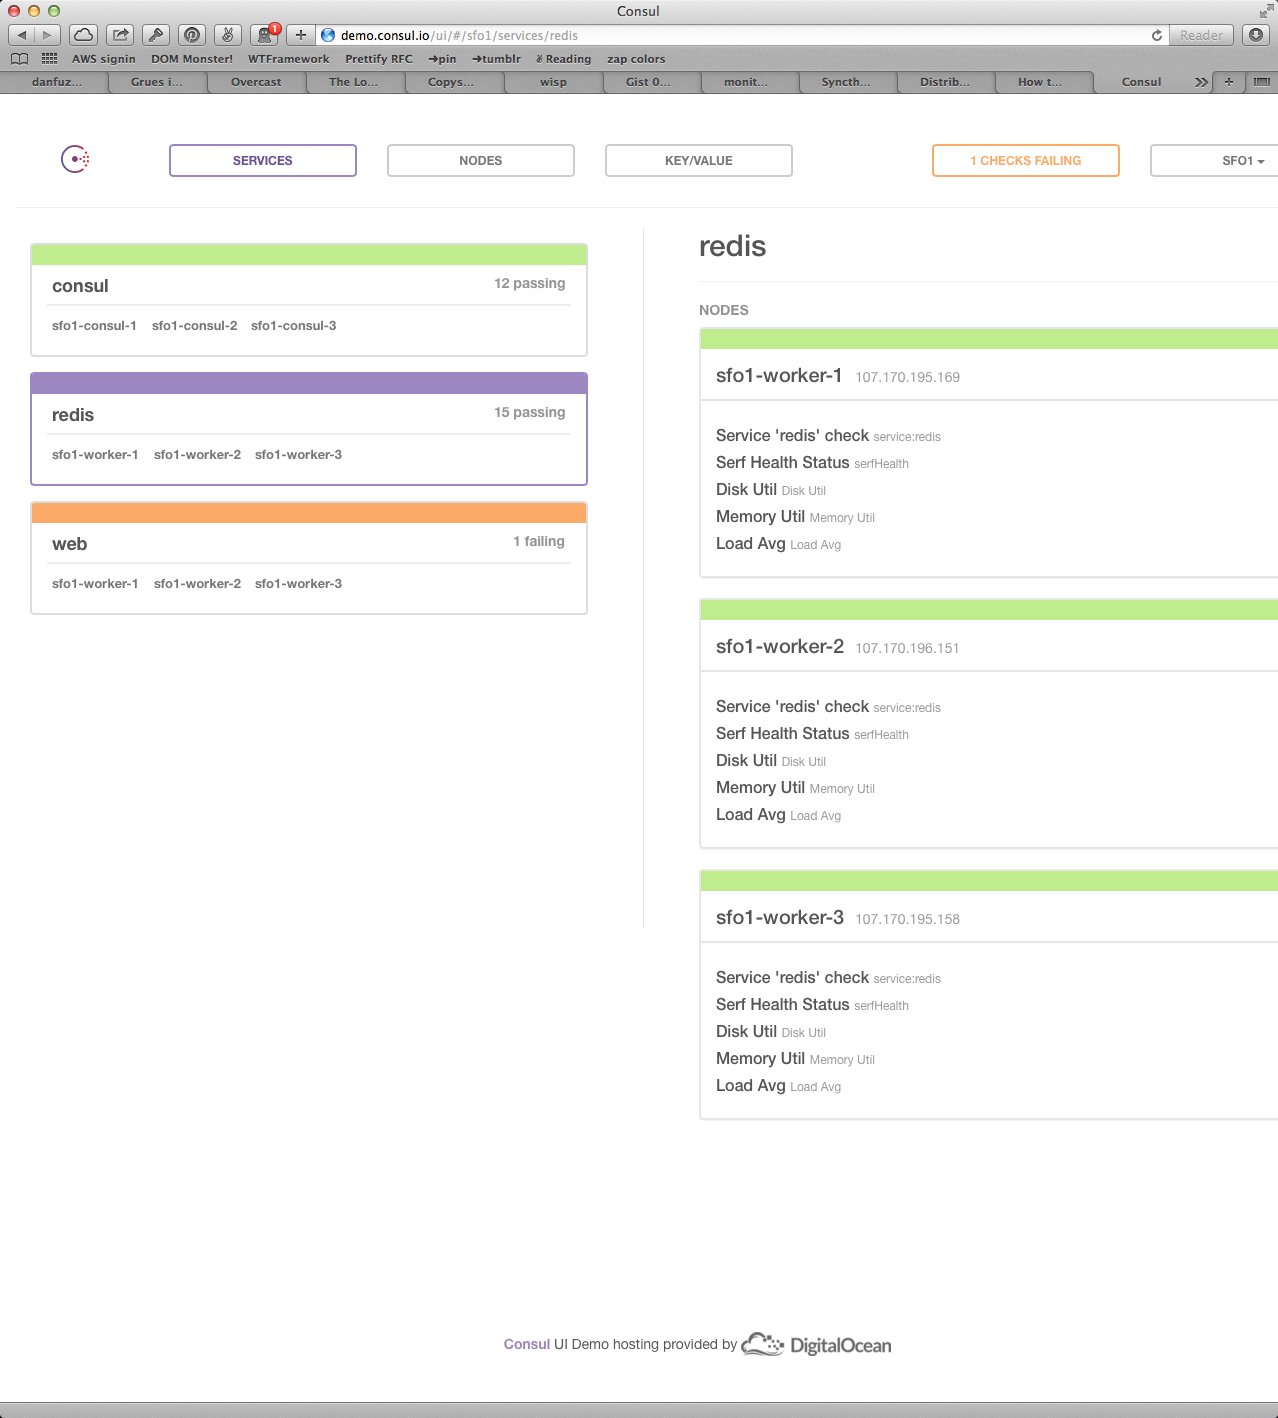
Therefore it is not acceptable as a dashboard or for analysis. In fact, I'd use this display only for debugging my Consul setup.

  • Riemann: accepts incoming data streams & interprets/displays/alerts based on criteria you provide. Requires writing Clojure to add data types. Can handle high volumes of incoming data. Does not store. (Thus would provide the dashboard & alerting components of the system, but is not complete by itself.)

Riemann looks like this:

Riemann in action

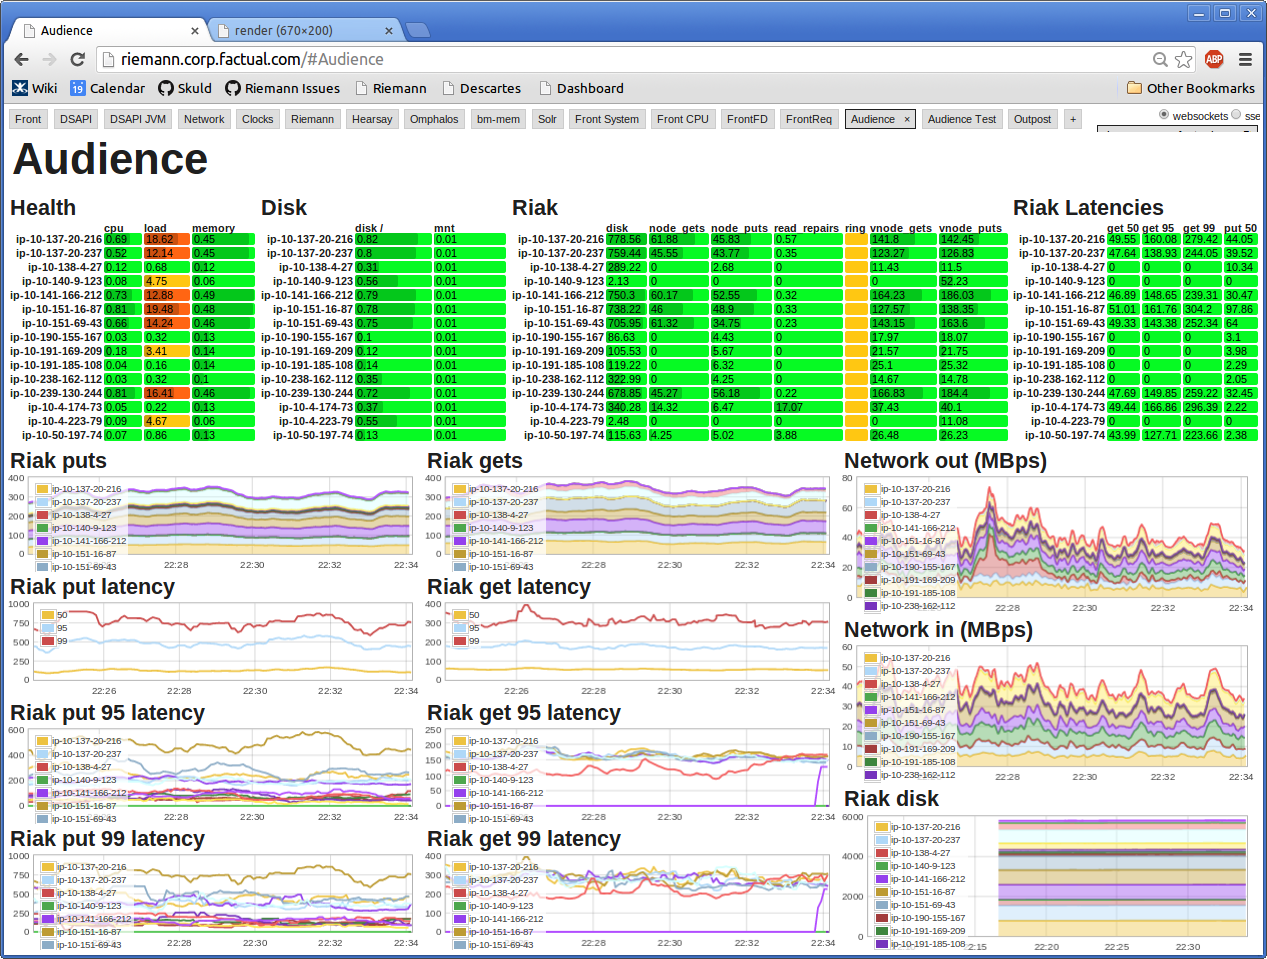
This will win no awards from graphic designers but it is a focused, information-packed dashboard. It wins a "useful!" award from me.

  • Time series database to store the metrics data. InfluxDB is probably my first pick.

  • Grafana to provide a dashboard.

Rejected proposal (too complex)

  • Consul as agent/collector (our ansible automation can set up consul agents on new nodes easily)
  • Riemann for monitoring & alerting
  • data needs to be split out of consul & streamed to riemann & the timeseries db
  • build dashboarding separately or start with Riemann's sinatra webapp (replace with node webapp over time)

What I'm probably going to build

  • Custom emitters & a collector/multiplexer (statsd-inspired)
  • Riemann
  • InfluxDB
  • Grafana

Who needs Consul? Just write agents fired by cron that sit on each host or in each server emitting whenever it's interesting to emit. Send to Riemann & to the timeseries database. Riemann for monitoring, hand-rolled dashboards for historical analysis. (Voxer's Zag is an inspiration here, except that I feel it misses its chance by not doing alerting as well.)

Now the million-dollar question: what's the opportunity cost of this work next to, say, working on npm's features? And now we know why dev/ops software is so terrible.

But I'm going to work on this on the weekends, because I want it a lot.

UPDATE

I did an implementation spike with InfluxDB, Riemann, and a custom emitter/collector modules I wrote. I've rejected Riemann as unsuitable for a number of reasons (jvm, clojure to configure, fragile/poor dashboard), but InfluxDB looks great so far. Grafana also looks great for historical/longer-term dashboards. My next implementation spike will feature Mozilla's heka and an exploration of what it would take to write the short-term data flow display/alerting/monitoring piece myself.

@plord
Copy link

plord commented May 11, 2014

Interestingly enough [my former startup] did years of work hacking the innards of HP Openview, of all things, to accomplish two of your primary features:

  1. We wrote time series monitoring agents for various OS and applications we had under management, then smuggled those time series data and even some generated alert patterns back to the central monitoring server encapsulated in an OV message type and flowing through the same firewall route/messaging protocol as "normal" (i.e. polled and useless) HPOV alert types.
  2. We hacked the queueing bits of OV to recognize our smuggled messages and handle them differently. All our data went to a data warehouse to generate long tern trending reports, create special alert types for capacity planning, and other tricks. If the data was an alert calculated by our code, it also went to the HP alert browser.
  3. Now that I think about it, we also scraped the alert browser data into the warehouse; most dashboards destroy that data as soon as you ack the alert. Absurdity.

This let us do all kinds of tricks, like, watching inbound MQ channels on a central server from 12 different financial firms (who hid their end of the queue behind a black box firewall), then alert based on % variations in the mean time to enqueue and dequeue a message on those channels, with independent alert thresholds for each institution. Historical reporting on trends for that mean time let us evolve those thresholds as the banks all got merged. Historical analysis using the data warehouse let us compare 5 years of Black Friday-Cyber Monday traffic patterns for [big online retailer you have definitely used] and now we start capacity planning for that weekend in JUNE every year.

I never knew how crap the rest of the monitoring world was until I had to live without our mutant lovechild. If you're solving these problems again I would love to help in some way. If I can, anyway; my main input to the hackery above, other than sometimes managing that team, was discovering new and exciting real-world manual firedrill examples to capture, standardize, and automate.

@plord
Copy link

plord commented May 11, 2014

At the risk of blowing up your scope, here are a few Non-Obvious features you may wish you had included earlier at some future date:

  • Your tool must, must, must consume data from your automation and/or Release Management tools. Chef/Puppet/Ansible, Opsware or whatever it is called now, MS System Center; anything you are likely to encounter. tracking release frequency, % of code/config changed, etc. over time, plus running systemic checks like "Are we absolutely sure that every server on that production LAN has patch X and build Y.Z?"
  • The dashboard should allow you to overlay this automation data over any time series trendline. "Memory consumption was stable across 7 build cycles...until this last one when it exploded. No, look: that dot is the production release, see the trendline start increasing immediately."
  • For any database you are likely to encounter with this tool, you should track some metadata: "slowest 5 queries this week/this month/since last release" is my primary example. Compare this list of queries to itself regularly; any new member may be an as-yet-untriggered failure mode that will fire as soon as users know how to get to that query in large numbers. That is: one or two queries of that type by post-release QA doesn't cause issues, but 100 a minute when a feature launches is death on wheels.
  • Data Warehousing alert and time series data must be as flat as possible. You may want a report on different performance characteristics across two different patchlevels of your OS, OR you may want multiple data types dashboarded but only for one specific OS patchlevel. Any assumption you make about bits of data always being aligned/synced/inseparable...you're gonna want to separate them. Probably in the midst of a production outage.

I bet I have more, have to think about it a bit. Those examples always come to mind as missing features of production monitoring and automation suites though.

Maybe I am over-reaching in assuming you want your monitoring and config/release/automation tools to speak to each other. I suggest that you will eventually have wished that they had been all along.

@plord
Copy link

plord commented May 11, 2014

Also: in Cloud environments, you will want to think long and hard about what you mean when you say "this server named Foo." When a hardware node fails and your VM is migrated invisibly across the cluster...what happens?

  • Do you claim it is the same VM, keep its name, transfer its release and incident history to the "new" Foo?
  • Do you rename the VM and restart everything?
  • Do you keep the release history to preserve tracking of patchlevels and builds, BUT restart the incident history so you can learn fascinating new things like how your new host is a firmware level behind, or an older hardware platform entirely, or the backplane is 5x as congested because of noisy neighbors, or those drives are slower than the ones you were on before?
  • Do you only restart hardware incidents? Assume app errors are tracked and corrected with the release system?
  • If you pick an option that changes the name, never mind your monitoring system, does the Release system need changes to either learn about or ignore the new server?

You may note my skepticism regarding the uniformity and standardization of currently available cloud platforms.

@ceejbot
Copy link
Author

ceejbot commented May 15, 2014

YES to the comments about release data & other events needing to enter the database. I consider "change to version of deployed software" to be an event worth recording & displaying somehow. This data can be critical for diagnosis. "Oh look, the frammistan service started falling over when we deployed 2.0 of the blodger service." Voxer's Zag system has this. Love it.

And I will ponder your questions, for which I have no immediate answers. And I suspect there are no firmly correct answers, only tradeoffs.

@robey
Copy link

robey commented May 16, 2014

two things i liked from cuckoo/koalabird (twitter's home-built monitoring & alerting system):

  1. the alterting system could alert on trends, like "errors increased by more than 10% over 5 minutes". this was a great way to stop fretting about tiny spikes and worry about a larger problem.
  2. page only for actionable items. if a server rebooted, but that didn't really affect the number of errors we threw, then DO NOT wake me up. everything is flaky and deserves a chance to recover with dignity.

@dannycoates
Copy link

I would probably skip Consul if I wasn't going to use it's other features and write a bunch of tiny node scripts that emit metrics instead. But if I was going to use the other stuff then, sure why not?

I get the impression that the health checking in Consul is mostly a "value add" feature on top of the consensus protocol and meant to report predefined state changes rather than a data stream. Still useful for many things (especially the HA aspect) and maybe good for the trigger part of feedback control, but not for trending and analysis.

@dannycoates
Copy link

If you'd rather not write your own collector/multiplexer check out heka. We use it for both log aggregation and stats. Its also got some basic graphing and alerting, scriptable with lua.

memory graph

@bcoe
Copy link

bcoe commented May 17, 2014

I love the idea of alerting based on aggregated metrics. In the past, I've used graphite in association with Nagios. I can think of multiple occasions where a broken build is released, and I've been alerted immediately based on a dip in a graph.

Some random thoughts of mine:

  • it would be awesome to have a standard built into the monitoring software for setting up alerts based on common patterns in graphs:
    • a graph suddenly hitting zero.
    • major changes in the peaks of a graph.
    • mainly, it would be nice for us to give some stuff for free; writing formulas in Graphite (and probably other graphing libraries) is a hassle.
  • metrics aggregation is a hard problem, one thing I'll say in nagios' favor is that it rarely falls over (I don't know if I've ever seen it crash). I can't say the same thing about aggregation libraries I've used. Graphite routinely fills a disk.
    • I agree with metrics aggregation being an important part of a next generation monitoring system, but I think that the aggregator needs to be separated out, so that it can be run on its own isolated server.
    • I don't think that all things are necessarily metrics, some basic yes or no checks on public facing services are good to have (granted yes or no could be a binary metric). we should have support for things like:
    • check_ssh.
    • check_http.
  • this brings me to my next point, a migration path from nagios would be nice. It would be awesome if a next generation monitoring solution could take existing nagios checks off the shelf, and pull them into its infrastructure; potentially converting the warn, critical, ok error codes to a metric stream.

Just some random thoughts for now, one thing that jumped out at me was:

  • aggregation, notification, and UI components should be independent (the notification part needs to be insanely bullet proof).
  • it would be great to offer a migration path from nagios.
  • I still think we'll want checks on the boxes themselves, and on a central host.

@plord
Copy link

plord commented May 19, 2014

@robey is on to something with his second item. You could summarize the goal of every monitoring system as: "Provide the least amount of most actionable information to the operator." This leads to a couple of non-obvious requirements:

  • You need a way to suppress "obvious duplicates." When the DB fails, and all of your app/web instances throw, say, a connection pool error, you want your alert system to throw up the red flag once and only once; emitters should continue to send up/down/slow/whatever data at the system, but if you're working for 15 minutes on the DB, you ALREADY KNOW the apps are borked. A perfect system would automatically correlate all similar errors within the same time chunk as being the same alert (and would further assign all of the app alerts as children of the parent DB alert), but that's asking a lot. In the meantime, it is enough that your alert engine knows the difference between 1) First notification of a problem=alert and set a bit somewhere, 2) subsequent time series versions of the same problem=store data but suppress alert storm per that bit you just set, and 3) system restored=reset the alert bit to fire on next instance.
  • Absent the perfect system outlined above, your system needs some way of allowing the operator to retroactively associate different elements of a system-wide issue to one "ticket" or "alert" or...I dunno, tag? You will want to do both micro- and macro-analysis of system problems at times, and having to reconstruct a 2 hour outage from hundreds or thousands of individual alerts can be uh, tedious.
  • In my experience, for very large and active systems, no operator, no matter how skilled, can handle visually/manually sorting and analyzing alerts above a certain volume. This is important for the period when you are working on the "what is actionable?" and "What requires a human?" parts of the equation. 3% actionable (1 in 33 alerts = human intervention) is the boundary of effectiveness for a big shop; at 1 in 50, or 1 in 100, it is guaranteed that some avoidable issue will be missed due to human error/information overload. You should track that actionable % and if it gets too low, look for more classes of alert that can be automatically fixed/acked/suppressed.
  • Maybe the most obvious thing: age old common failure modes need to be automated ruthlessly to avoid cluttering the data. Log files filling up a disk should never cause an alert that a human needs to handle. Yes, you're rotating and compressing older version and have a retention schedule, blah blah, but when that fails because of overzealous marketing or other unexpected success, you want the system to nuke the older compressed copies without a second thought. You want your system to track the expiration date of your SSL certs and throw a Priority 1 alert 3 months before that expiration. And so forth. I've seen more sites taken offline by dumb stuff like this than by JVM memory leaks...

@charles-haynes
Copy link

@plord the technique I see used to avoid the "duplicate errors" problem is the Circuit Breaker pattern

@avimar
Copy link

avimar commented Sep 8, 2015

This came up in a google search. Any updates?

I'm looking for the least-complicated way to store/query/alert from my 3-5 server cluster + 10 or so processes.
Fluentd for log aggregation came up without the complexity of graylog, but then doesn't include a viewing layer as you described. Probably just use influxdb?

Sign up for free to join this conversation on GitHub. Already have an account? Sign in to comment