Created
April 16, 2012 14:49
-
-
Save neggert/2399228 to your computer and use it in GitHub Desktop.
Function for plotting histogram with error bars
This file contains bidirectional Unicode text that may be interpreted or compiled differently than what appears below. To review, open the file in an editor that reveals hidden Unicode characters.
Learn more about bidirectional Unicode characters
| import matplotlib.pyplot as plt | |
| import numpy as np | |
| import inspect | |
| def hist_errorbars( data, xerrs=True, *args, **kwargs) : | |
| """Plot a histogram with error bars. Accepts any kwarg accepted by either numpy.histogram or pyplot.errorbar""" | |
| # pop off normed kwarg, since we want to handle it specially | |
| norm = False | |
| if 'normed' in kwargs.keys() : | |
| norm = kwargs.pop('normed') | |
| # retrieve the kwargs for numpy.histogram | |
| histkwargs = {} | |
| for key, value in kwargs.iteritems() : | |
| if key in inspect.getargspec(np.histogram).args : | |
| histkwargs[key] = value | |
| histvals, binedges = np.histogram( data, **histkwargs ) | |
| yerrs = np.sqrt(histvals) | |
| if norm : | |
| nevents = float(sum(histvals)) | |
| binwidth = (binedges[1]-binedges[0]) | |
| histvals = histvals/nevents/binwidth | |
| yerrs = yerrs/nevents/binwidth | |
| bincenters = (binedges[1:]+binedges[:-1])/2 | |
| if xerrs : | |
| xerrs = (binedges[1]-binedges[0])/2 | |
| else : | |
| xerrs = None | |
| # retrieve the kwargs for errorbar | |
| ebkwargs = {} | |
| for key, value in kwargs.iteritems() : | |
| if key in inspect.getargspec(plt.errorbar).args : | |
| histkwargs[key] = value | |
| out = plt.errorbar(bincenters, histvals, yerrs, xerrs, fmt=".", **ebkwargs) | |
| if 'log' in kwargs.keys() : | |
| if kwargs['log'] : | |
| plt.yscale('log') | |
| if 'range' in kwargs.keys() : | |
| plt.xlim(*kwargs['range']) | |
| return out |
Sign up for free
to join this conversation on GitHub.
Already have an account?
Sign in to comment
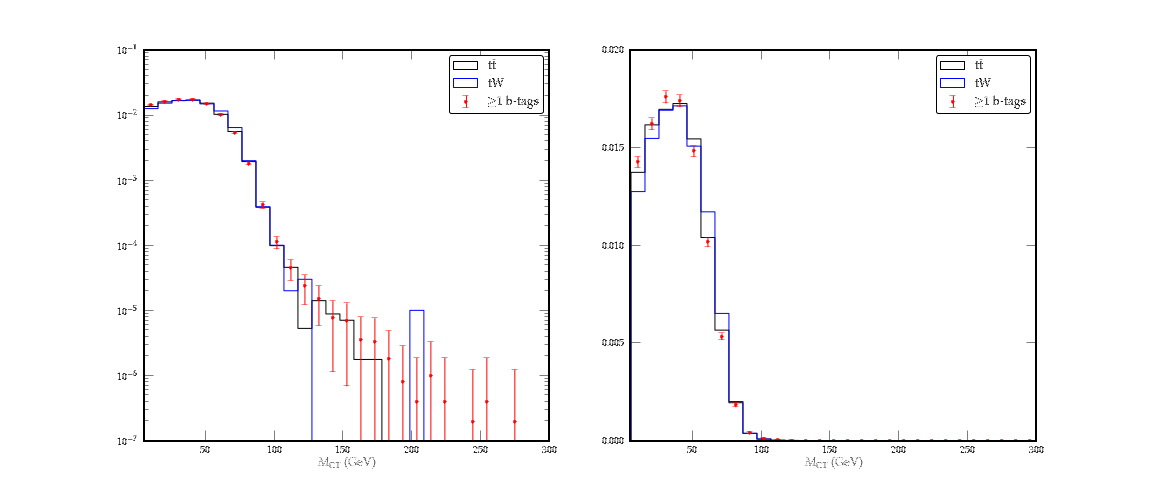
Example of the output: