Francesco Saverio Zuppichini This template aims to make it easier for you to start a new deep learning computer vision project with PyTorch. The main features are:
- modularity: we split each logic piece into a different python submodule
- data-augmentation: we included imgaug
- ready to go: by using poutyne a Keras-like framework you don't have to write any train loop.
- torchsummary to show a summary of your models
- reduce the learning rate on a plateau
- auto-saving the best model
- experiment tracking with comet
Let's face it, usually data scientists are not software engineers and they usually end up with spaghetti code, most of the time on a big unusable Jupiter-notebook. With this repo, you have proposed a clean example of how your code should be split and modularized to make scalability and sharability possible. In this example, we will try to classify Darth Vader and Luke Skywalker. We have 100 images per class gathered using google images. The dataset is here. You just have to exact it in this folder and run main.py. We are fine-tuning resnet18 and it should be able to reach > 90% accuracy in 5/10 epochs.
The template is inside ./template.
https://gist.github.com/f19101c817a01f910e9dad336b3aa8f8
We strongly encourage to play around with the template
Every deep learning project has at least three mains steps:
- data gathering/processing
- modeling
- training/evaluating
One good idea is to store all the paths at an interesting location, e.g. the dataset folder, in a shared class that be accessed by anyone in the folder. You should never hardcode any paths and always define them once and import them. So, if you later change your structure you will only have to modify one file.
If we have a look at Project.py we can see how we defined the data_dir and the checkpoint_dir once for all. We are using the 'new' Path APIs that supports different OS out of the box, and also make it easier to join and concatenate paths.
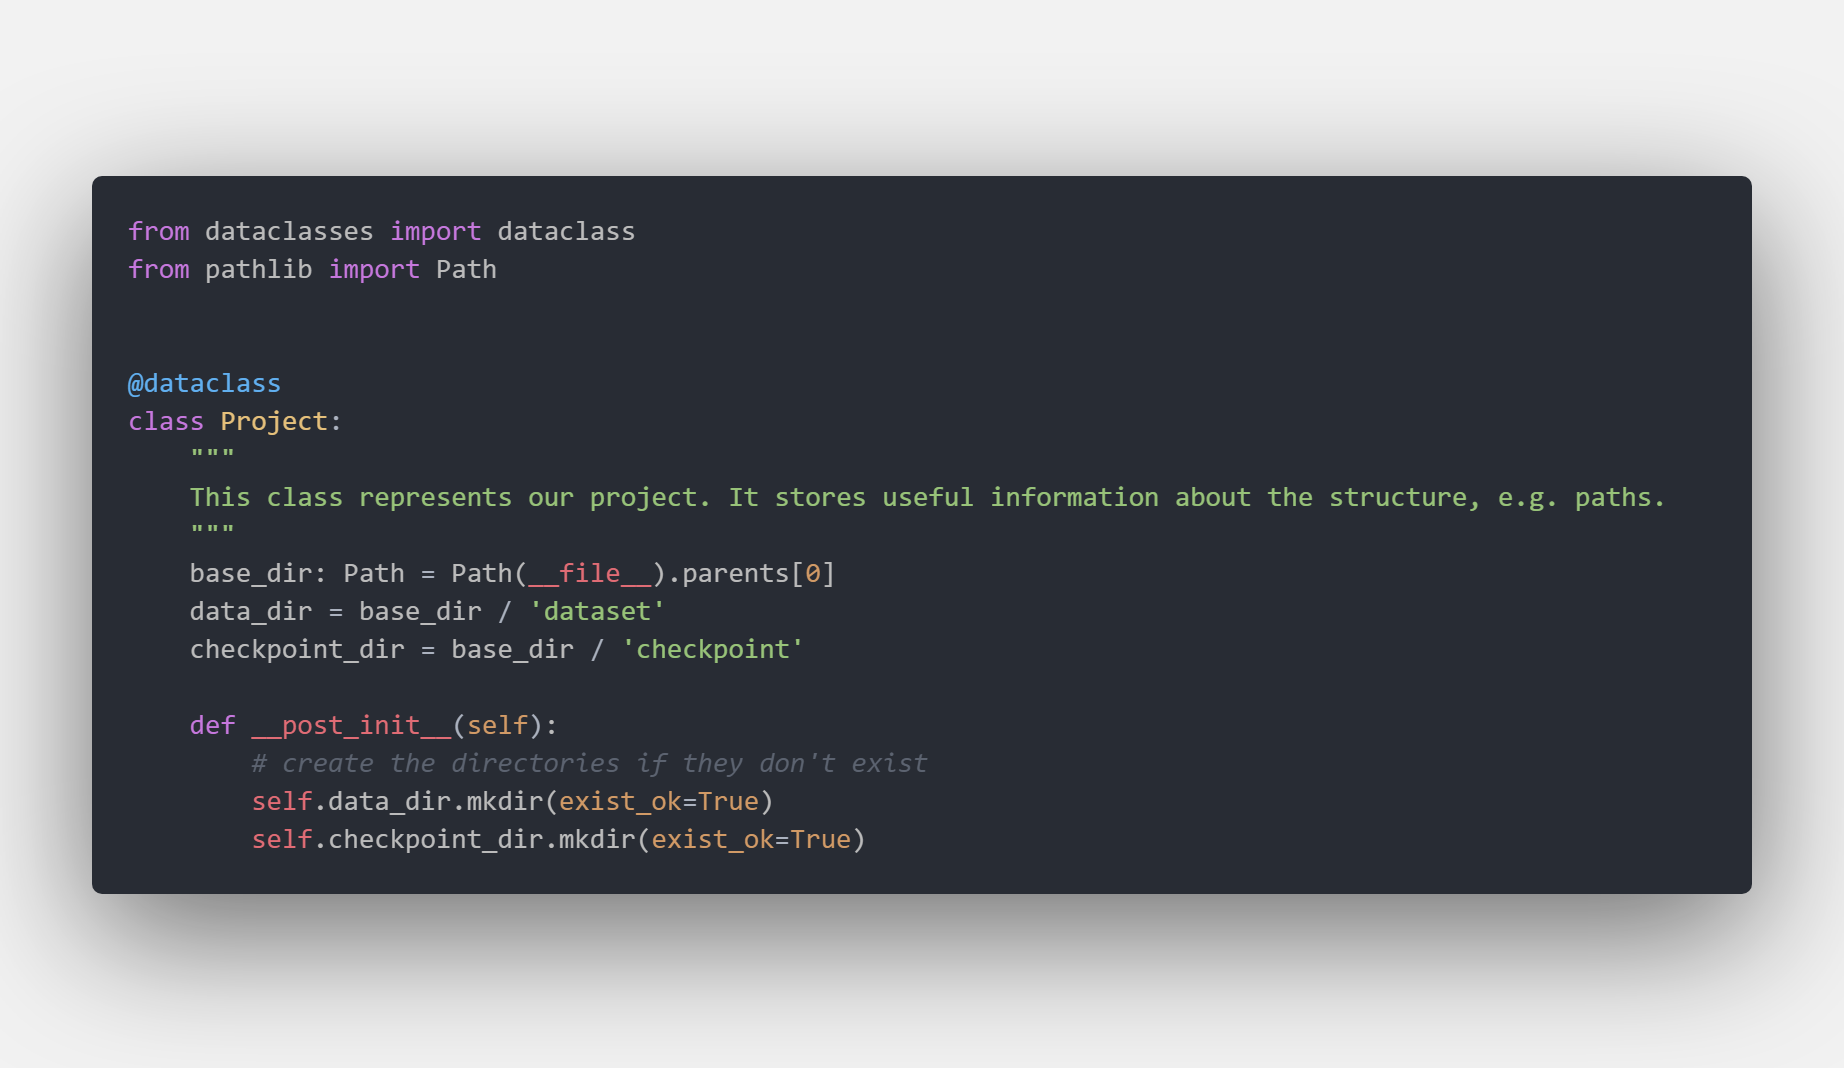 For example, if we want to know the data location we can :
https://gist.github.com/b76b4b280109641446fedcd08ceca535
For example, if we want to know the data location we can :
https://gist.github.com/b76b4b280109641446fedcd08ceca535
In the data package you can define your own Dataset, as always by subclassing torch.data.utils.Dataset, exposing transformations and utilities to work with your data.
In our example, we directly used ImageDataset from torchvision but we included a skeleton for a custom Dataset in /data/MyDataset
You usually have to do some preprocessing on the data, e.g. resize the images and apply data augmentation. All your transformation should go inside .data.trasformation. In our template, we included a wrapper for
imgaug
![]()
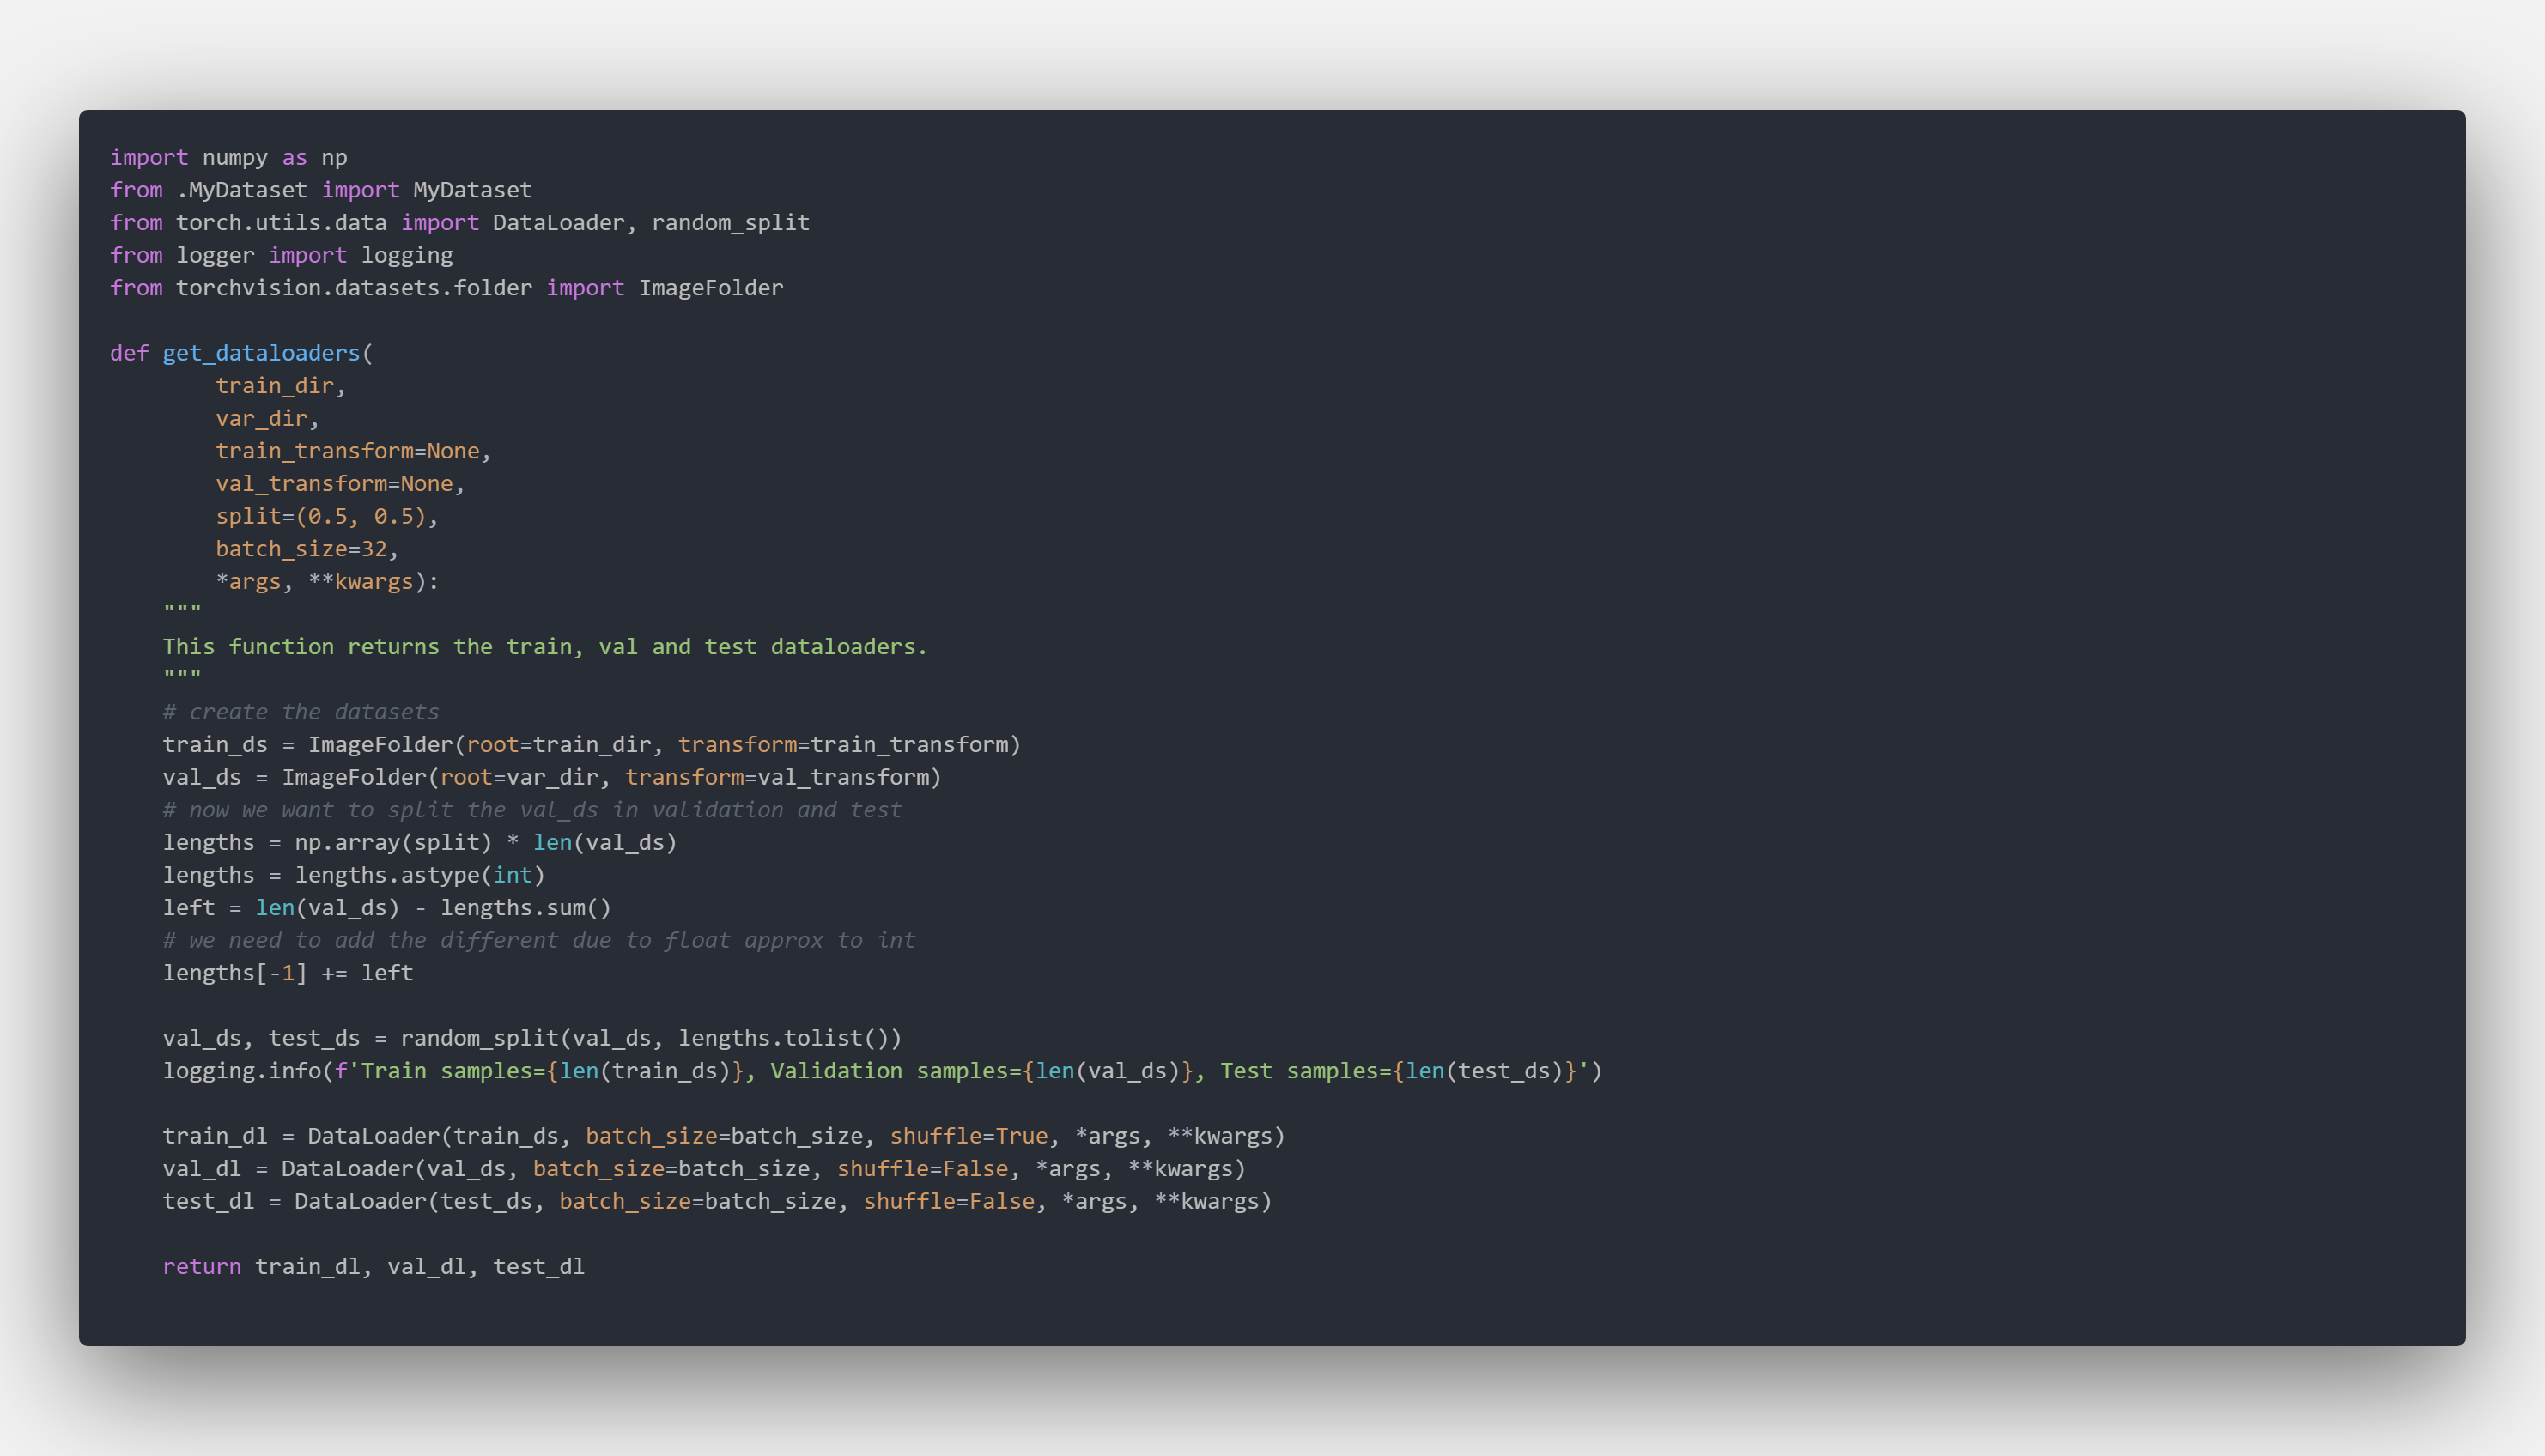
As you know, you have to create a Dataloader to feed your data into the model. In the data.__init__.py file we expose a very simple function get_dataloaders to automatically configure the train, val and test data loaders using few parameters
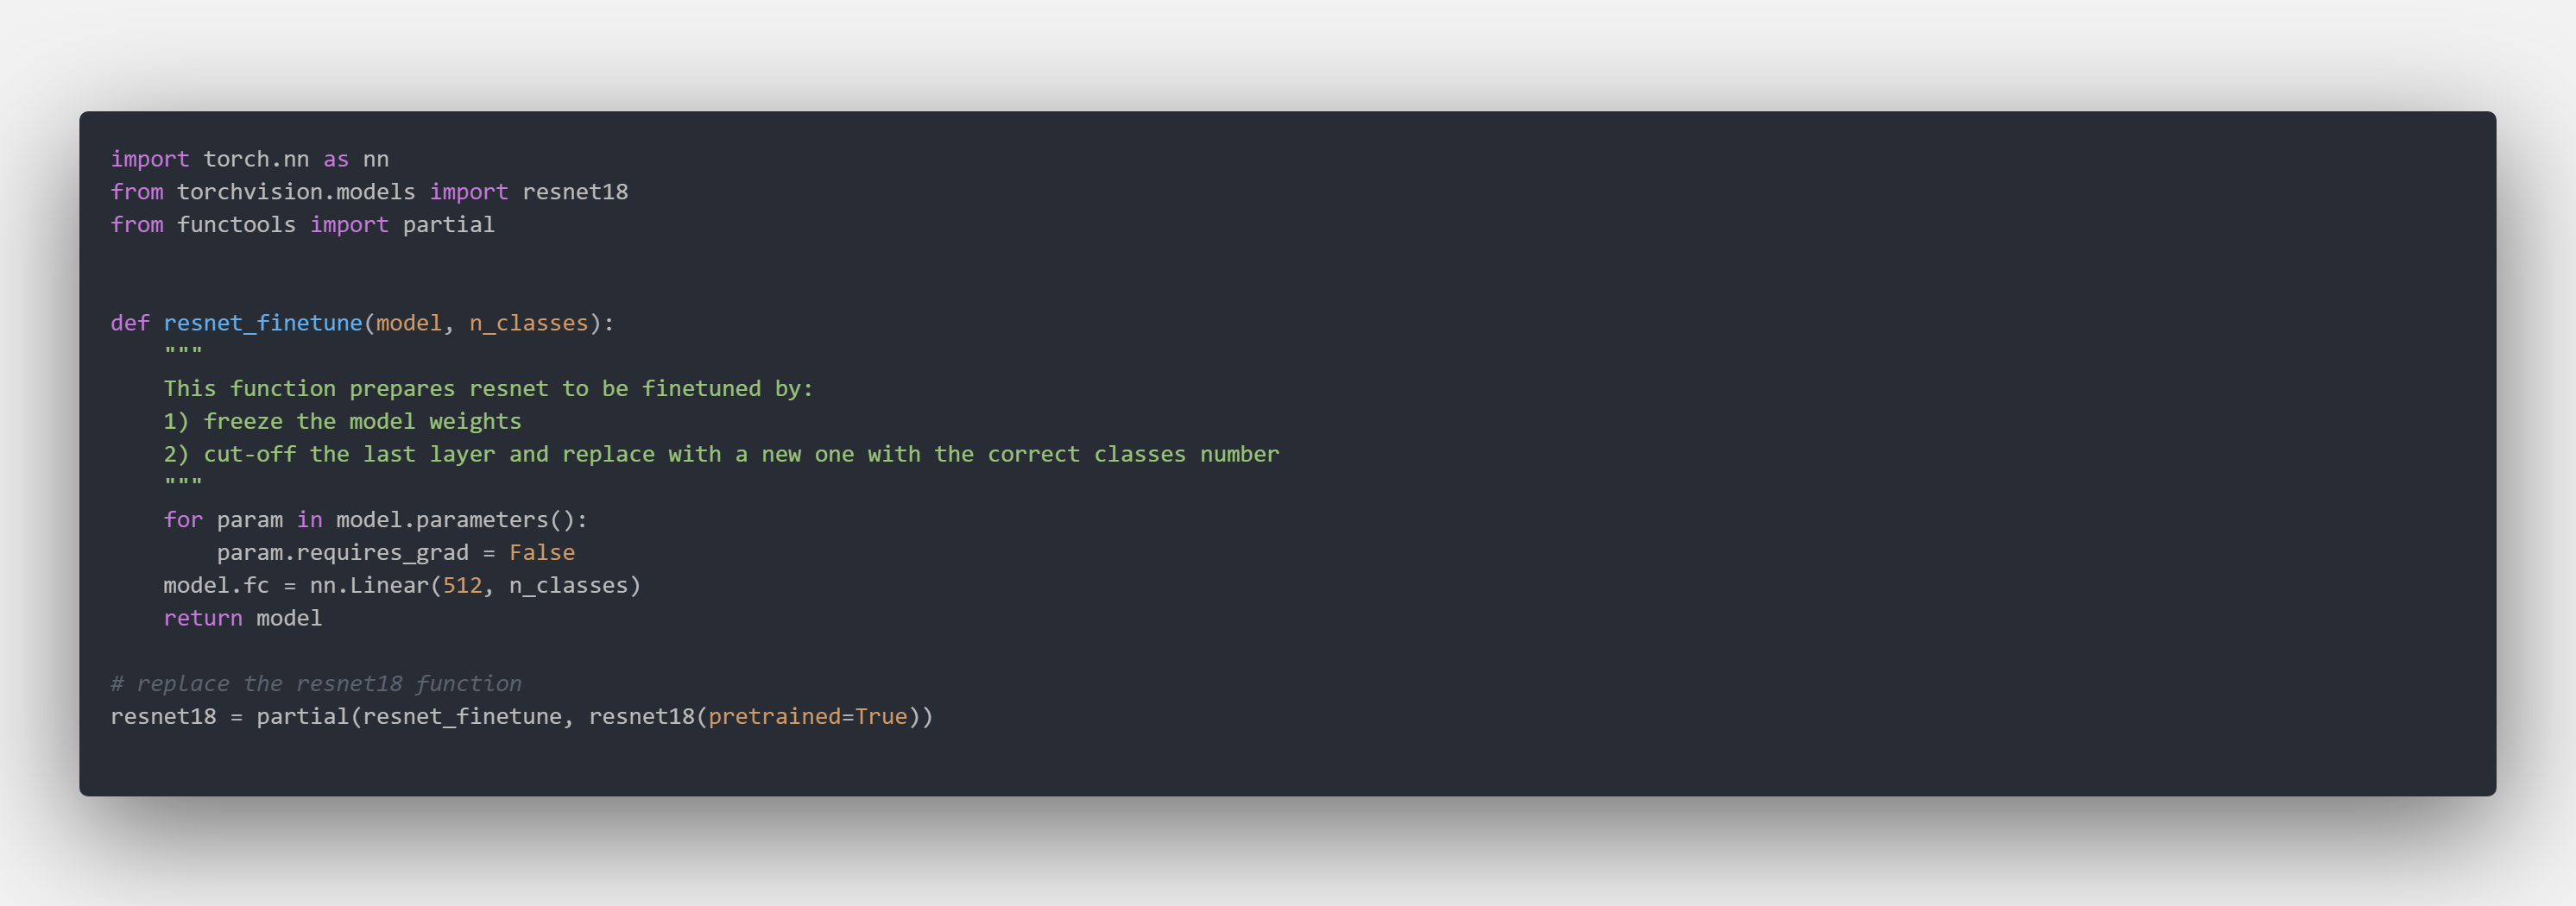
All your models go inside models, in our case we have a very basic cnn and we override the resnet18 function to provide a frozen model to finetune.
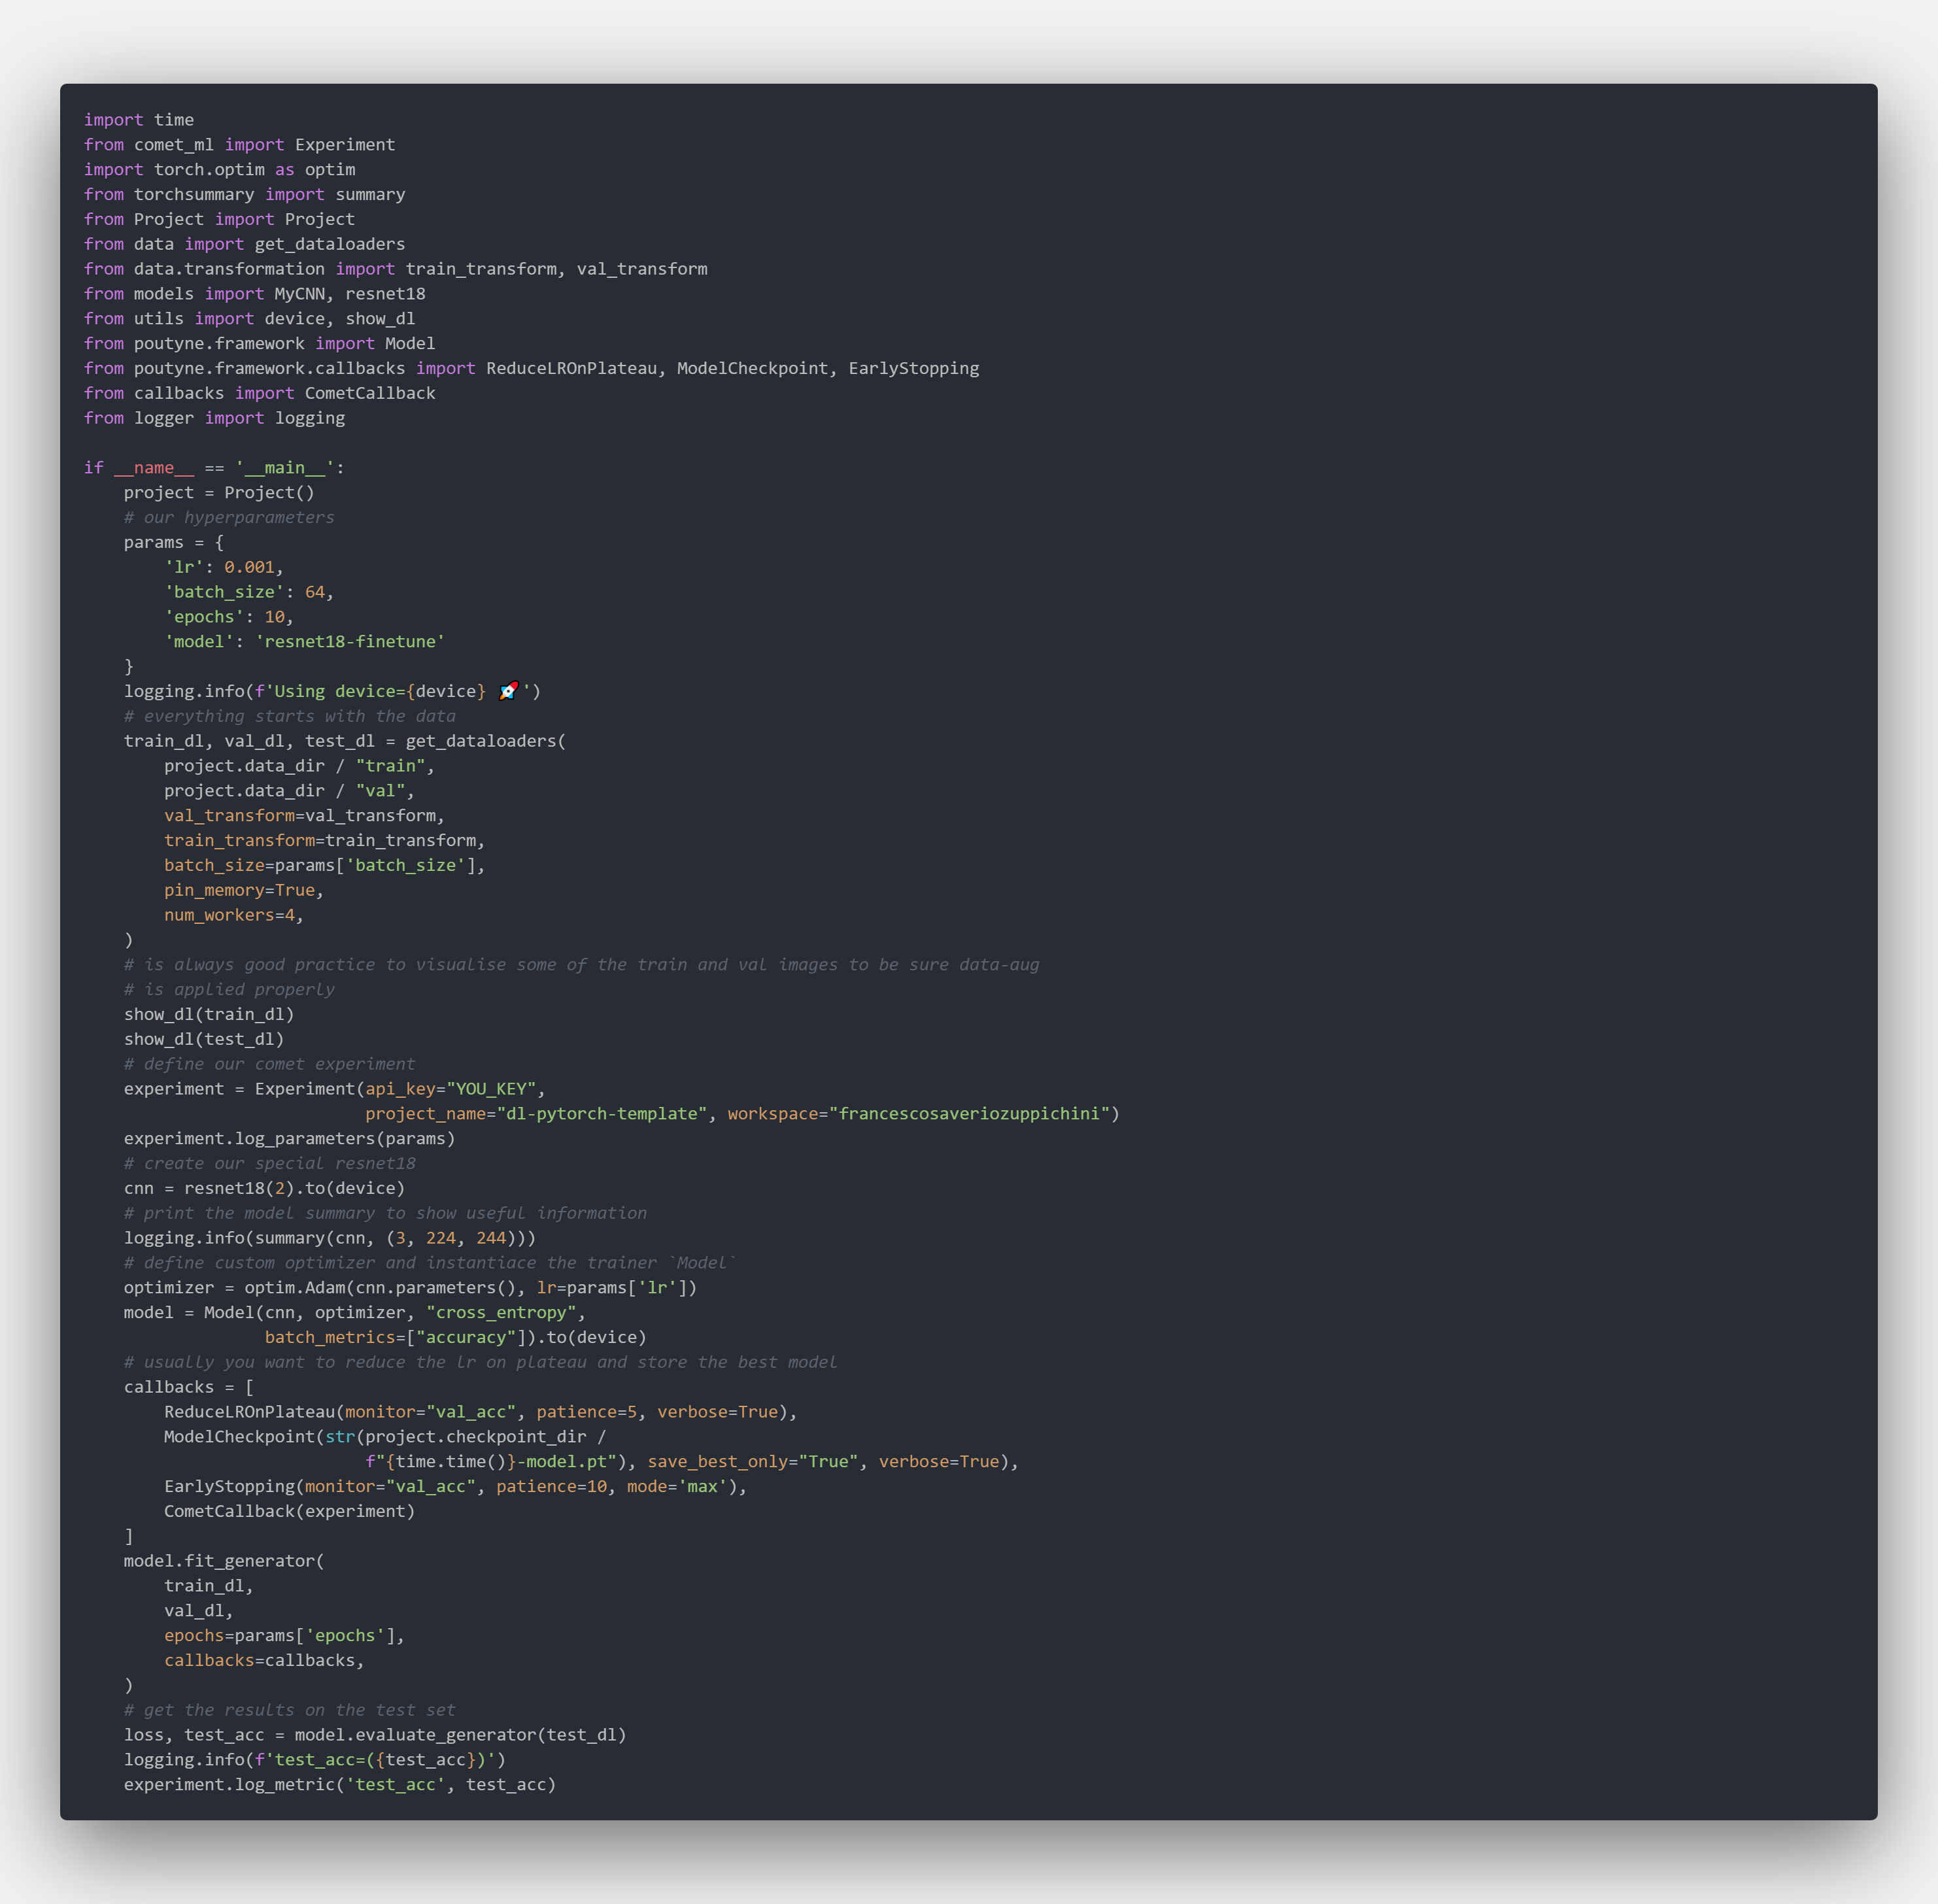
In our case we kept things simple, all the training and evaluation logic is inside .main.py where we used poutyne as the main library. We already defined a useful list of callbacks:
- learning rate scheduler
- auto-save of the best model
- early stopping
Usually, this is all you need!

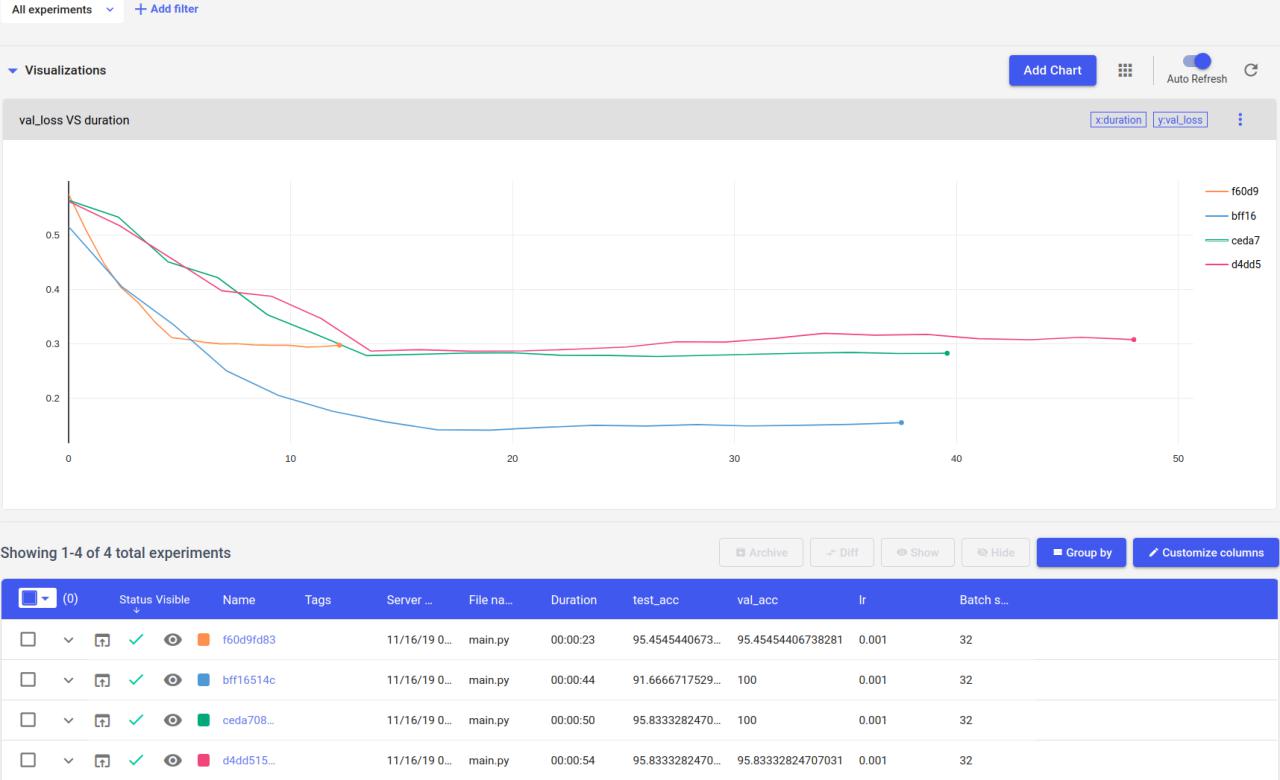
We are using comet to automatically track our models' results. This is what comet's board looks like after a few models run.
 Running
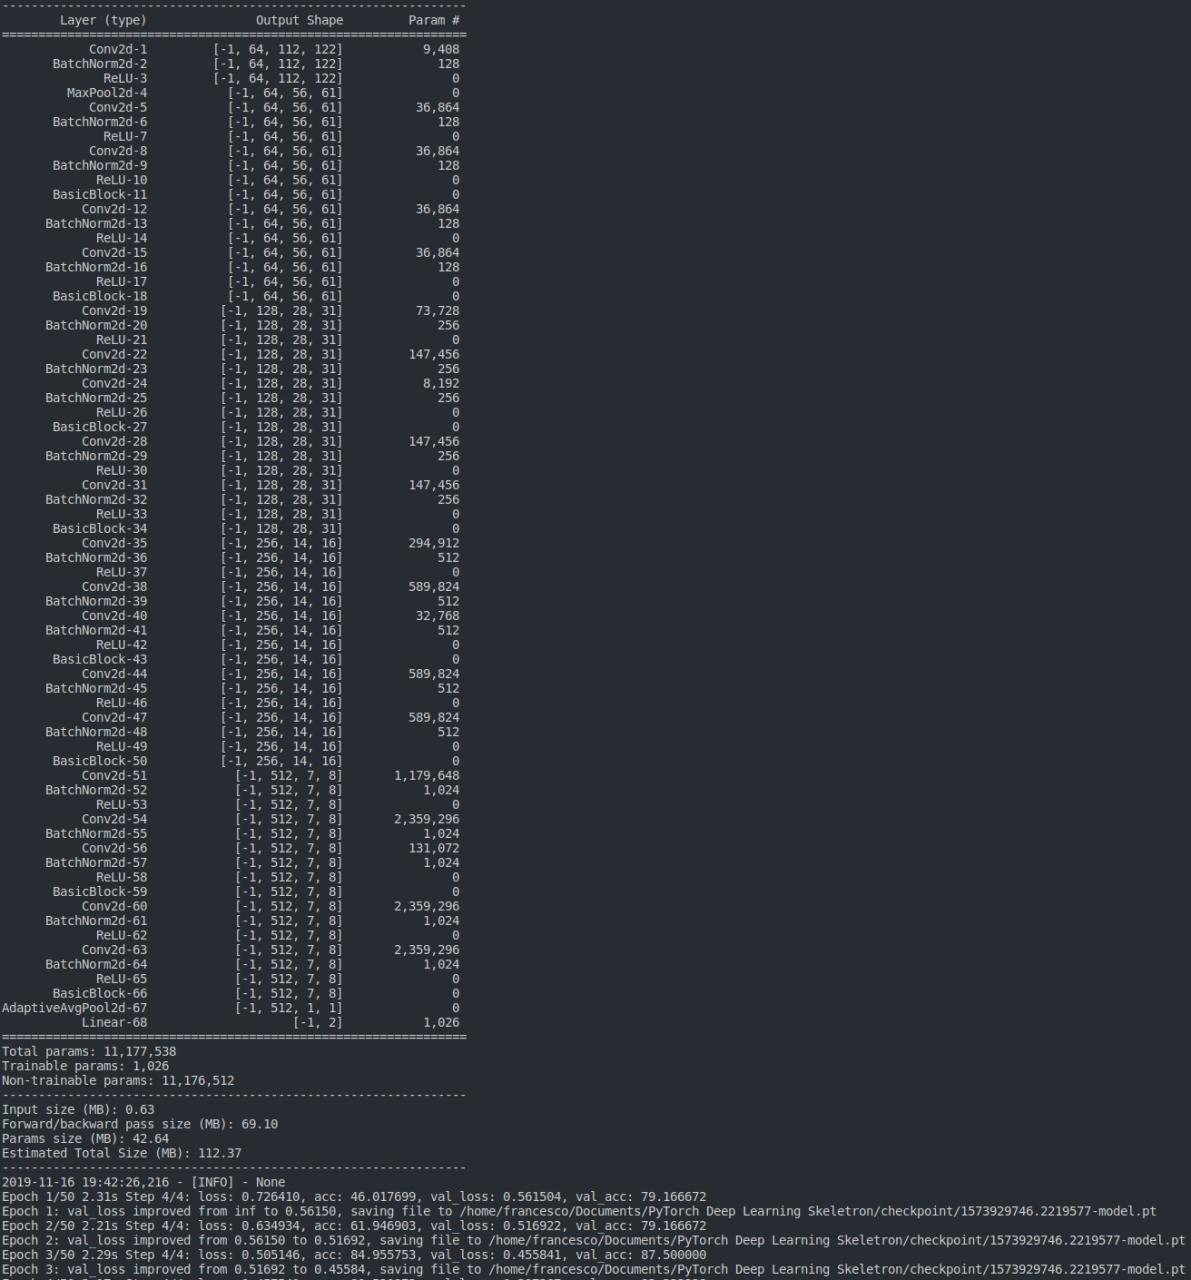
 main.py produces the following output:
We also created different utilities function to plot booth dataset and dataloader. They are in utils.py. For example, calling show_dl on our train and val dataset produces the following outputs.
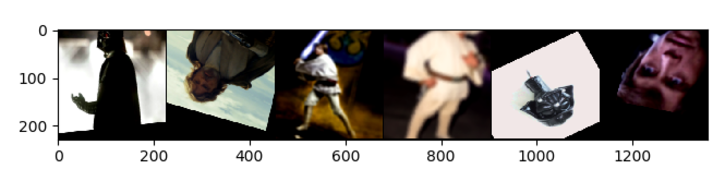
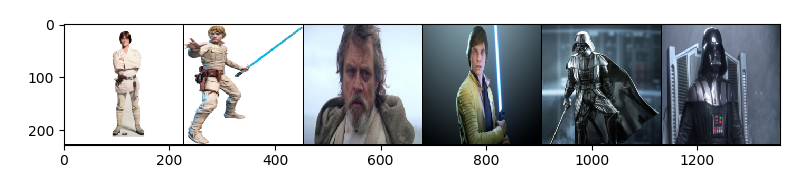 As you can see data-augmentation is correctly applied on the train set
I hope you found some useful information and hopefully you will start to organize your next project better. Let me know if you have some ideas/suggestions to improve it. Thank you for reading