Skip to content

Instantly share code, notes, and snippets.

View PaladhiDinesh's full-sized avatar

Dinesh Kumar Paladhi PaladhiDinesh

View GitHub Profile
@PaladhiDinesh
PaladhiDinesh / README.md
Last active January 27, 2016 00:12
D3 and R sample works on bar charts

Dinesh Kumar Paladhi; CS 725:Information Visualization; Spring 2016; Computer Science; Old Dominion University

Working through the examples from Scott Murray's tutorial at http://alignedleft.com/tutorials/d3/

Built with blockbuilder.org

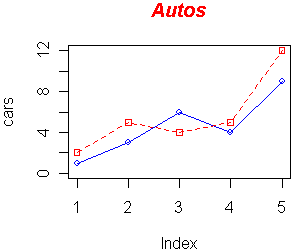
R Image using the dataset generated by D3 example. //To get the data use console.log(dataset) in the javascript console
@PaladhiDinesh
PaladhiDinesh / README.md
Created January 26, 2016 21:58 — forked from weiglemc/README.md
Murray example
@PaladhiDinesh
PaladhiDinesh / README.md
Last active July 14, 2017 16:27
Group Assignment Week 3

ICW2: Football data analysis

Team Members: Dinesh Kumar Paladhi, Rithika Reddy Madugula, Bhavani Manthena

Assignment: ICW2: Football data analysis

CS 725: Information Visualization; Spring 2016; Computer Science; Old Dominion University

###Scatterplot Matrix

@PaladhiDinesh
PaladhiDinesh / README.md
Last active February 3, 2016 07:46
Visualization Implementation 2 Tableau and D3 Graphs

#Dinesh Kumar Paladhi

CS 725: Information Visualization ; Spring 2016; Computer Science; Old Dominion University

Question 1 : A list of 2 comments that you have about using Tableau -We can create visuals quickly and switch between types easily to find the model that best represents your message.
-The user interface is well-organized so you can customize the view with a few clicks

Question 2 : A list of 3 things that you learned while working through the D3 tutorial

@PaladhiDinesh
PaladhiDinesh / README.md
Last active February 10, 2016 07:00
Visualization Implementation (VI3)

###Dinesh Kumar Paladhi

CS 725: Information Visualization ; Spring 2016; Computer Science; Old Dominion University

####Three things from D3:

-Helped me to learn more about javascript and CSS
-Helped me to implement data from json file 
-Helped me to do transtions and animations
@PaladhiDinesh
PaladhiDinesh / README.md
Last active February 17, 2016 12:20
Visualization Implementaion 4
@PaladhiDinesh
PaladhiDinesh / README.md
Last active February 24, 2016 07:19
VI5 Submission

All the figures are done using excel.

##Rule of Thumb

No unjustified 3D: Occlusion hides information : Some of the objects cannot be seen becomes of other objects. The height or are of one attribute covers other attribute.

###Bad Design

To show a bad design I used 3D column plots. Here the count of all the categories of students in an institution is taken in different years. Each category of students is represented by differenct colored blocks and year on x-axis and count on y-axis.Z-axis has grad,undergrad, Phd,High School and Secondary school.

@PaladhiDinesh
PaladhiDinesh / Readme.md
Last active March 16, 2016 06:59
Node- Link Diagram Visualization Implementation 7

###Insight gained:

  • The state that is connected to many states can be seen at the center of the graph whereas the least connected ones are at the corners. Example :- Maine is connected to only one state and so it is in the corner.
  • Connections between the states can be easily found out and number of hops between them can be easily calculated.
  • All the states from the same regions are with the same color.
@PaladhiDinesh
PaladhiDinesh / Readme.md
Last active March 16, 2016 07:17
Matrix View - Visualization Implementation 7

###Insight gained:

  • We can order either by region or alphabetical order or number of links.
  • By ordering the states in alphabetical order, we can easily track down a state and its number of connections if we traverse through the particular row or column
  • By ordering the number of links we get the state with higher number of links on top left and least number of links on bottom right.
  • In all the orderings the states from the same region are with the same color.
@PaladhiDinesh
PaladhiDinesh / Readme.md
Last active April 8, 2020 11:53
Webscience Assignment 6 - 1

Use D3 to visualize your Twitter followers. Use my twitter account ("@phonedude_mln") if you do not have >= 50 followers. For example, @hvdsomp follows me, as does @mart1nkle1n. They also follow each other, so they would both have links to me and links to each other.

To see if two users follow each other, see: https://dev.twitter.com/rest/reference/get/friendships/show

Attractiveness of the graph counts! Nodes should be labeled (avatar images are even better), and edge types (follows, following) should