Skip to content

Instantly share code, notes, and snippets.

View PaladhiDinesh's full-sized avatar

Dinesh Kumar Paladhi PaladhiDinesh

View GitHub Profile
@PaladhiDinesh
PaladhiDinesh / README.md
Last active February 10, 2016 07:00
Visualization Implementation (VI3)

###Dinesh Kumar Paladhi

CS 725: Information Visualization ; Spring 2016; Computer Science; Old Dominion University

####Three things from D3:

-Helped me to learn more about javascript and CSS
-Helped me to implement data from json file 
-Helped me to do transtions and animations
@PaladhiDinesh
PaladhiDinesh / README.md
Last active February 3, 2016 07:46
Visualization Implementation 2 Tableau and D3 Graphs

#Dinesh Kumar Paladhi

CS 725: Information Visualization ; Spring 2016; Computer Science; Old Dominion University

Question 1 : A list of 2 comments that you have about using Tableau -We can create visuals quickly and switch between types easily to find the model that best represents your message.
-The user interface is well-organized so you can customize the view with a few clicks

Question 2 : A list of 3 things that you learned while working through the D3 tutorial

@PaladhiDinesh
PaladhiDinesh / README.md
Last active July 14, 2017 16:27
Group Assignment Week 3

ICW2: Football data analysis

Team Members: Dinesh Kumar Paladhi, Rithika Reddy Madugula, Bhavani Manthena

Assignment: ICW2: Football data analysis

CS 725: Information Visualization; Spring 2016; Computer Science; Old Dominion University

###Scatterplot Matrix

@PaladhiDinesh
PaladhiDinesh / README.md
Created January 26, 2016 21:58 — forked from weiglemc/README.md
Murray example
@PaladhiDinesh
PaladhiDinesh / README.md
Last active January 27, 2016 00:12
D3 and R sample works on bar charts

Dinesh Kumar Paladhi; CS 725:Information Visualization; Spring 2016; Computer Science; Old Dominion University

Working through the examples from Scott Murray's tutorial at http://alignedleft.com/tutorials/d3/

Built with blockbuilder.org

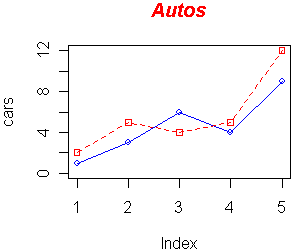
R Image using the dataset generated by D3 example. //To get the data use console.log(dataset) in the javascript console