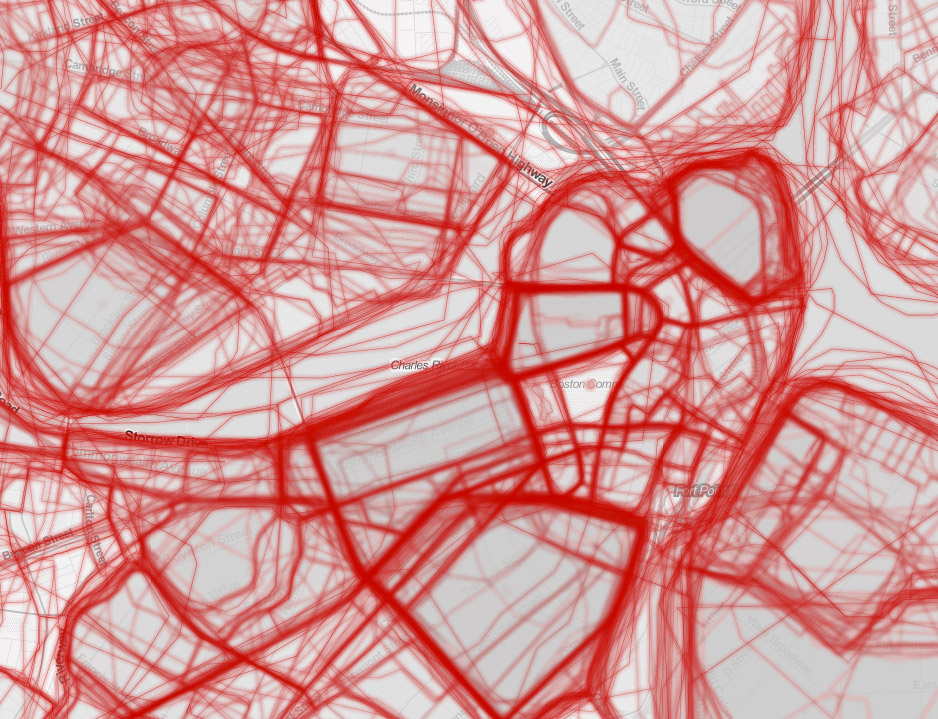
This is an attempt at a slightly D3-ish way of drawing a dot density map on a canvas element. In short, each polygon is drawn (invisibly) with a unique color, then random points are thrown at polygon bounding boxes and the pixel color is used for a point-in-polygon test. This example draws one dot for every 2 people in central Boston census blocks, for a total of approximately 132,000 dots.
Andy Woodruff awoodruff
This file contains bidirectional Unicode text that may be interpreted or compiled differently than what appears below. To review, open the file in an editor that reveals hidden Unicode characters.
Learn more about bidirectional Unicode characters
| <html> | |
| <head> | |
| <title>A Leaflet map!</title> | |
| <link rel="stylesheet" href="http://cdn.leafletjs.com/leaflet-0.7.3/leaflet.css"/> | |
| <script src="http://cdn.leafletjs.com/leaflet-0.7.3/leaflet.js"></script> | |
| <script src="https://code.jquery.com/jquery-2.1.1.min.js"></script> | |
| <style> | |
| #map{ height: 100% } | |
| </style> | |
| </head> |
This file contains bidirectional Unicode text that may be interpreted or compiled differently than what appears below. To review, open the file in an editor that reveals hidden Unicode characters.
Learn more about bidirectional Unicode characters
| .marker-cluster-small { | |
| background-color: rgba(181, 226, 140, 0.6); | |
| } | |
| .marker-cluster-small div { | |
| background-color: rgba(110, 204, 57, 0.6); | |
| } | |
| .marker-cluster-medium { | |
| background-color: rgba(241, 211, 87, 0.6); | |
| } |
This file contains bidirectional Unicode text that may be interpreted or compiled differently than what appears below. To review, open the file in an editor that reveals hidden Unicode characters.
Learn more about bidirectional Unicode characters
| // creates GeoJSON features (using Turfjs) for square grid cells in the Mercator projection | |
| function grid(minX,minY,maxX,maxY,size){ // arguments are in projected mercator units; conversion functions below | |
| var x = minX, | |
| y = minY, | |
| cells = [], | |
| x0, | |
| y0, | |
| x1, | |
| y1; |
Sorry, something went wrong. Reload?
Sorry, we cannot display this file.
Sorry, this file is invalid so it cannot be displayed.
Doug Greenfield (@MapOfTheWeek) made a perfect map projection example for Maptime Boston: rat projections! Using his world rat shapefile, here's an interactive version. As always, this is based on on the D3 Map Projection Transitions example by Jason Davies.
#ratmap!
A ton of overlapping polygons, representing neighborhoods that people drew and named. (GeoJSON here.) Well-known neighborhoods will have many polygons with the same name, and similar shapes.
A summary map of polygons representing the area where each neighborhood name is dominant. That is, the area where a given neighborhood name is used more than any other neighborhood name.