Created
January 15, 2022 16:43
-
-
Save icychocolate98/c1e64395e584325d49221cf3c4e784c3 to your computer and use it in GitHub Desktop.
Simple Api using Api to calculate Bitcoin stock values the last X days and showing results with matplotlib.
This file contains bidirectional Unicode text that may be interpreted or compiled differently than what appears below. To review, open the file in an editor that reveals hidden Unicode characters.
Learn more about bidirectional Unicode characters
| { | |
| "cells": [ | |
| { | |
| "metadata": {}, | |
| "cell_type": "markdown", | |
| "source": "<center>\n <img src=\"https://cf-courses-data.s3.us.cloud-object-storage.appdomain.cloud/IBMDeveloperSkillsNetwork-PY0101EN-SkillsNetwork/IDSNlogo.png\" width=\"300\" alt=\"cognitiveclass.ai logo\" />\n</center>\n\n# Application Programming Interface\n\nEstimated time needed: **15** minutes\n\n## Objectives\n\nAfter completing this lab you will be able to:\n\n* Create and Use APIs in Python\n" | |
| }, | |
| { | |
| "metadata": {}, | |
| "cell_type": "markdown", | |
| "source": "### Introduction\n\nAn API lets two pieces of software talk to each other. Just like a function, you don\u2019t have to know how the API works only its inputs and outputs. An essential type of API is a REST API that allows you to access resources via the internet. In this lab, we will review the Pandas Library in the context of an API, we will also review a basic REST API\n" | |
| }, | |
| { | |
| "metadata": {}, | |
| "cell_type": "markdown", | |
| "source": "## Table of Contents\n\n<div class=\"alert alert-block alert-info\" style=\"margin-top: 20px\">\n<li><a href=\"https://#ref0\">Pandas is an API</a></li>\n<li><a href=\"https://#ref1\">REST APIs Basics </a></li>\n<li><a href=\"https://#ref2\">Quiz on Tuples</a></li>\n\n</div>\n\n<hr>\n" | |
| }, | |
| { | |
| "metadata": { | |
| "jupyter": { | |
| "outputs_hidden": false | |
| } | |
| }, | |
| "cell_type": "code", | |
| "source": "!pip install pycoingecko\n!pip install plotly\n!pip install mplfinance", | |
| "execution_count": 1, | |
| "outputs": [ | |
| { | |
| "output_type": "stream", | |
| "text": "Collecting pycoingecko\n Downloading pycoingecko-2.2.0-py3-none-any.whl (8.3 kB)\nRequirement already satisfied: requests in /opt/conda/envs/Python-3.8-main/lib/python3.8/site-packages (from pycoingecko) (2.25.1)\nRequirement already satisfied: certifi>=2017.4.17 in /opt/conda/envs/Python-3.8-main/lib/python3.8/site-packages (from requests->pycoingecko) (2021.10.8)\nRequirement already satisfied: idna<3,>=2.5 in /opt/conda/envs/Python-3.8-main/lib/python3.8/site-packages (from requests->pycoingecko) (2.8)\nRequirement already satisfied: urllib3<1.27,>=1.21.1 in /opt/conda/envs/Python-3.8-main/lib/python3.8/site-packages (from requests->pycoingecko) (1.26.6)\nRequirement already satisfied: chardet<5,>=3.0.2 in /opt/conda/envs/Python-3.8-main/lib/python3.8/site-packages (from requests->pycoingecko) (3.0.4)\nInstalling collected packages: pycoingecko\nSuccessfully installed pycoingecko-2.2.0\nRequirement already satisfied: plotly in /opt/conda/envs/Python-3.8-main/lib/python3.8/site-packages (4.14.3)\nRequirement already satisfied: six in /opt/conda/envs/Python-3.8-main/lib/python3.8/site-packages (from plotly) (1.15.0)\nRequirement already satisfied: retrying>=1.3.3 in /opt/conda/envs/Python-3.8-main/lib/python3.8/site-packages (from plotly) (1.3.3)\nCollecting mplfinance\n Downloading mplfinance-0.12.8b6-py3-none-any.whl (64 kB)\n\u001b[K |\u2588\u2588\u2588\u2588\u2588\u2588\u2588\u2588\u2588\u2588\u2588\u2588\u2588\u2588\u2588\u2588\u2588\u2588\u2588\u2588\u2588\u2588\u2588\u2588\u2588\u2588\u2588\u2588\u2588\u2588\u2588\u2588| 64 kB 3.3 MB/s eta 0:00:01\n\u001b[?25hRequirement already satisfied: matplotlib in /opt/conda/envs/Python-3.8-main/lib/python3.8/site-packages (from mplfinance) (3.3.4)\nRequirement already satisfied: pandas in /opt/conda/envs/Python-3.8-main/lib/python3.8/site-packages (from mplfinance) (1.2.4)\nRequirement already satisfied: pyparsing!=2.0.4,!=2.1.2,!=2.1.6,>=2.0.3 in /opt/conda/envs/Python-3.8-main/lib/python3.8/site-packages (from matplotlib->mplfinance) (2.4.7)\nRequirement already satisfied: kiwisolver>=1.0.1 in /opt/conda/envs/Python-3.8-main/lib/python3.8/site-packages (from matplotlib->mplfinance) (1.3.1)\nRequirement already satisfied: numpy>=1.15 in /opt/conda/envs/Python-3.8-main/lib/python3.8/site-packages (from matplotlib->mplfinance) (1.19.2)\nRequirement already satisfied: cycler>=0.10 in /opt/conda/envs/Python-3.8-main/lib/python3.8/site-packages (from matplotlib->mplfinance) (0.10.0)\nRequirement already satisfied: pillow>=6.2.0 in /opt/conda/envs/Python-3.8-main/lib/python3.8/site-packages (from matplotlib->mplfinance) (8.4.0)\nRequirement already satisfied: python-dateutil>=2.1 in /opt/conda/envs/Python-3.8-main/lib/python3.8/site-packages (from matplotlib->mplfinance) (2.8.1)\nRequirement already satisfied: six in /opt/conda/envs/Python-3.8-main/lib/python3.8/site-packages (from cycler>=0.10->matplotlib->mplfinance) (1.15.0)\nRequirement already satisfied: pytz>=2017.3 in /opt/conda/envs/Python-3.8-main/lib/python3.8/site-packages (from pandas->mplfinance) (2021.1)\nInstalling collected packages: mplfinance\nSuccessfully installed mplfinance-0.12.8b6\n", | |
| "name": "stdout" | |
| } | |
| ] | |
| }, | |
| { | |
| "metadata": {}, | |
| "cell_type": "markdown", | |
| "source": "<h2 id=\"PandasAPI\">Pandas is an API </h2>\n" | |
| }, | |
| { | |
| "metadata": {}, | |
| "cell_type": "markdown", | |
| "source": "Pandas is actually set of software components , much of which is not even written in Python.\n" | |
| }, | |
| { | |
| "metadata": { | |
| "jupyter": { | |
| "outputs_hidden": false | |
| } | |
| }, | |
| "cell_type": "code", | |
| "source": "import pandas as pd\nimport numpy as np\nimport plotly.graph_objects as go\nfrom plotly.offline import plot\nimport matplotlib.pyplot as plt\nimport datetime\nfrom pycoingecko import CoinGeckoAPI\nfrom mplfinance.original_flavor import candlestick2_ohlc", | |
| "execution_count": 2, | |
| "outputs": [] | |
| }, | |
| { | |
| "metadata": {}, | |
| "cell_type": "markdown", | |
| "source": "You create a dictionary, this is just data.\n" | |
| }, | |
| { | |
| "metadata": { | |
| "jupyter": { | |
| "outputs_hidden": false | |
| } | |
| }, | |
| "cell_type": "code", | |
| "source": "dict_={'a':[11,21,31],'b':[12,22,32]}\ndict_", | |
| "execution_count": 5, | |
| "outputs": [ | |
| { | |
| "output_type": "execute_result", | |
| "execution_count": 5, | |
| "data": { | |
| "text/plain": "{'a': [11, 21, 31], 'b': [12, 22, 32]}" | |
| }, | |
| "metadata": {} | |
| } | |
| ] | |
| }, | |
| { | |
| "metadata": {}, | |
| "cell_type": "markdown", | |
| "source": "When you create a Pandas object with the Dataframe constructor in API lingo, this is an \"instance\". The data in the dictionary is passed along to the pandas API. You then use the dataframe to communicate with the API.\n" | |
| }, | |
| { | |
| "metadata": { | |
| "jupyter": { | |
| "outputs_hidden": false | |
| } | |
| }, | |
| "cell_type": "code", | |
| "source": "df=pd.DataFrame(dict_)\ntype(df)", | |
| "execution_count": 6, | |
| "outputs": [ | |
| { | |
| "output_type": "execute_result", | |
| "execution_count": 6, | |
| "data": { | |
| "text/plain": "pandas.core.frame.DataFrame" | |
| }, | |
| "metadata": {} | |
| } | |
| ] | |
| }, | |
| { | |
| "metadata": {}, | |
| "cell_type": "markdown", | |
| "source": "<img src = \"https://cf-courses-data.s3.us.cloud-object-storage.appdomain.cloud/IBMDeveloperSkillsNetwork-PY0101EN-SkillsNetwork/labs/Module%205/images/pandas_api.png\" width = 800, align = \"center\" alt=\"logistic regression block diagram\" />\n" | |
| }, | |
| { | |
| "metadata": {}, | |
| "cell_type": "markdown", | |
| "source": "When you call the method head the dataframe communicates with the API displaying the first few rows of the dataframe.\n" | |
| }, | |
| { | |
| "metadata": { | |
| "jupyter": { | |
| "outputs_hidden": false | |
| } | |
| }, | |
| "cell_type": "code", | |
| "source": "df.head()", | |
| "execution_count": 7, | |
| "outputs": [ | |
| { | |
| "output_type": "execute_result", | |
| "execution_count": 7, | |
| "data": { | |
| "text/plain": " a b\n0 11 12\n1 21 22\n2 31 32", | |
| "text/html": "<div>\n<style scoped>\n .dataframe tbody tr th:only-of-type {\n vertical-align: middle;\n }\n\n .dataframe tbody tr th {\n vertical-align: top;\n }\n\n .dataframe thead th {\n text-align: right;\n }\n</style>\n<table border=\"1\" class=\"dataframe\">\n <thead>\n <tr style=\"text-align: right;\">\n <th></th>\n <th>a</th>\n <th>b</th>\n </tr>\n </thead>\n <tbody>\n <tr>\n <th>0</th>\n <td>11</td>\n <td>12</td>\n </tr>\n <tr>\n <th>1</th>\n <td>21</td>\n <td>22</td>\n </tr>\n <tr>\n <th>2</th>\n <td>31</td>\n <td>32</td>\n </tr>\n </tbody>\n</table>\n</div>" | |
| }, | |
| "metadata": {} | |
| } | |
| ] | |
| }, | |
| { | |
| "metadata": {}, | |
| "cell_type": "markdown", | |
| "source": "When you call the method mean,the API will calculate the mean and return the value.\n" | |
| }, | |
| { | |
| "metadata": { | |
| "jupyter": { | |
| "outputs_hidden": false | |
| } | |
| }, | |
| "cell_type": "code", | |
| "source": "df.mean()", | |
| "execution_count": 8, | |
| "outputs": [ | |
| { | |
| "output_type": "execute_result", | |
| "execution_count": 8, | |
| "data": { | |
| "text/plain": "a 21.0\nb 22.0\ndtype: float64" | |
| }, | |
| "metadata": {} | |
| } | |
| ] | |
| }, | |
| { | |
| "metadata": {}, | |
| "cell_type": "markdown", | |
| "source": "<h2 id=\"ref1\">REST APIs</h2>\n" | |
| }, | |
| { | |
| "metadata": {}, | |
| "cell_type": "markdown", | |
| "source": "Rest API\u2019s function by sending a request, the request is communicated via HTTP message. The HTTP message usually contains a JSON file. This contains instructions for what operation we would like the service or resource to perform. In a similar manner, API returns a response, via an HTTP message, this response is usually contained within a JSON.\n\nIn cryptocurrency a popular method to display the movements of the price of a currency.\n\n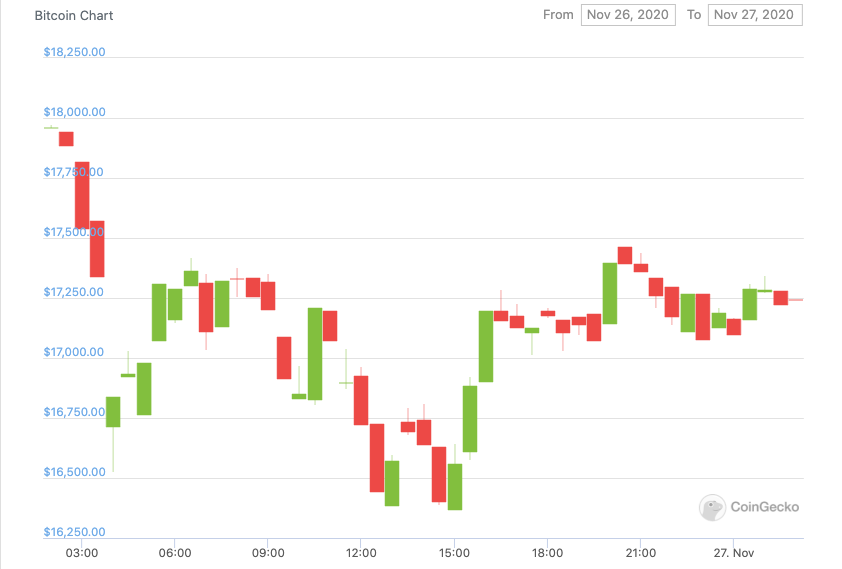\n\nHere is a description of the candle sticks.\n\n<img src=\"https://cf-courses-data.s3.us.cloud-object-storage.appdomain.cloud/IBMDeveloperSkillsNetwork-PY0101EN-SkillsNetwork/labs/Module%205/explanation.png\" alt=\"Candle Stick Definition\" width=\"800\" height=\"600\">\n\nIn this lab, we will be using the <a href=https://www.coingecko.com/en/api?utm_medium=Exinfluencer&utm_source=Exinfluencer&utm_content=000026UJ&utm_term=10006555&utm_id=NA-SkillsNetwork-Channel-SkillsNetworkCoursesIBMDeveloperSkillsNetworkPY0101ENSkillsNetwork19487395-2021-01-01>CoinGecko API</a> to create one of these candlestick graphs for Bitcoin. We will use the API to get the price data for 30 days with 24 observation per day, 1 per hour. We will find the max, min, open, and close price per day meaning we will have 30 candlesticks and use that to generate the candlestick graph. Although we are using the CoinGecko API we will use a Python client/wrapper for the API called <a href=https://github.com/man-c/pycoingecko?utm_medium=Exinfluencer&utm_source=Exinfluencer&utm_content=000026UJ&utm_term=10006555&utm_id=NA-SkillsNetwork-Channel-SkillsNetworkCoursesIBMDeveloperSkillsNetworkPY0101ENSkillsNetwork19487395-2021-01-01>PyCoinGecko</a>. PyCoinGecko will make performing the requests easy and it will deal with the enpoint targeting.\n" | |
| }, | |
| { | |
| "metadata": {}, | |
| "cell_type": "markdown", | |
| "source": "Lets start off by getting the data we need. Using the <code>get_coin_market_chart_by_id(id, vs_currency, days)</code>. <code>id</code> is the name of the coin you want, <code>vs_currency</code> is the currency you want the price in, and <code>days</code> is how many days back from today you want.\n" | |
| }, | |
| { | |
| "metadata": {}, | |
| "cell_type": "code", | |
| "source": "cg = CoinGeckoAPI()\n\nbitcoin_data = cg.get_coin_market_chart_by_id(id='bitcoin', vs_currency='usd', days=30)", | |
| "execution_count": 23, | |
| "outputs": [] | |
| }, | |
| { | |
| "metadata": {}, | |
| "cell_type": "code", | |
| "source": "type(bitcoin_data )", | |
| "execution_count": 24, | |
| "outputs": [ | |
| { | |
| "output_type": "execute_result", | |
| "execution_count": 24, | |
| "data": { | |
| "text/plain": "dict" | |
| }, | |
| "metadata": {} | |
| } | |
| ] | |
| }, | |
| { | |
| "metadata": {}, | |
| "cell_type": "markdown", | |
| "source": "The response we get is in the form of a JSON which includes the price, market caps, and total volumes along with timestamps for each observation. We are focused on the prices so we will select that data.\n" | |
| }, | |
| { | |
| "metadata": {}, | |
| "cell_type": "code", | |
| "source": "bitcoin_price_data = bitcoin_data['prices']\n\nbitcoin_price_data[0:5]", | |
| "execution_count": 25, | |
| "outputs": [ | |
| { | |
| "output_type": "execute_result", | |
| "execution_count": 25, | |
| "data": { | |
| "text/plain": "[[1639674140096, 48587.51338921172],\n [1639677869417, 48175.01604749774],\n [1639681223360, 48009.72566569519],\n [1639684875673, 47869.71735116278],\n [1639688503045, 48132.30906342209]]" | |
| }, | |
| "metadata": {} | |
| } | |
| ] | |
| }, | |
| { | |
| "metadata": {}, | |
| "cell_type": "markdown", | |
| "source": "Finally lets turn this data into a Pandas DataFrame.\n" | |
| }, | |
| { | |
| "metadata": {}, | |
| "cell_type": "code", | |
| "source": "data = pd.DataFrame(bitcoin_price_data, columns=['TimeStamp', 'Price'])", | |
| "execution_count": 26, | |
| "outputs": [] | |
| }, | |
| { | |
| "metadata": {}, | |
| "cell_type": "markdown", | |
| "source": "Now that we have the DataFrame we will convert the timestamp to datetime and save it as a column called <code>Date</code>. We will map our <code>unix_to_datetime</code> to each timestamp and convert it to a readable datetime.\n" | |
| }, | |
| { | |
| "metadata": {}, | |
| "cell_type": "code", | |
| "source": "data['date'] = data['TimeStamp'].apply(lambda d: datetime.date.fromtimestamp(d/1000.0))\n", | |
| "execution_count": 27, | |
| "outputs": [] | |
| }, | |
| { | |
| "metadata": {}, | |
| "cell_type": "markdown", | |
| "source": "Using this modified dataset we can now group by the <code>Date</code> and find the min, max, open, and close for the candlesticks.\n" | |
| }, | |
| { | |
| "metadata": {}, | |
| "cell_type": "code", | |
| "source": "candlestick_data = data.groupby(data.date, as_index=False).agg({\"Price\": ['min', 'max', 'first', 'last']})", | |
| "execution_count": 28, | |
| "outputs": [] | |
| }, | |
| { | |
| "metadata": {}, | |
| "cell_type": "markdown", | |
| "source": "Finally we are now ready to use plotly to create our Candlestick Chart.\n" | |
| }, | |
| { | |
| "metadata": {}, | |
| "cell_type": "code", | |
| "source": "fig = go.Figure(data=[go.Candlestick(x=candlestick_data['date'],\n open=candlestick_data['Price']['first'], \n high=candlestick_data['Price']['max'],\n low=candlestick_data['Price']['min'], \n close=candlestick_data['Price']['last'])\n ])\n\nfig.update_layout(xaxis_rangeslider_visible=False)\n\nfig.show()", | |
| "execution_count": 29, | |
| "outputs": [ | |
| { | |
| "output_type": "display_data", | |
| "data": { | |
| "application/vnd.plotly.v1+json": { | |
| "config": { | |
| "plotlyServerURL": "https://plot.ly" | |
| }, | |
| "data": [ | |
| { | |
| "close": [ | |
| 47990.49542321248, | |
| 46507.965042542106, | |
| 46841.49510619506, | |
| 47519.78023498492, | |
| 47033.22355853823, | |
| 49341.61801683935, | |
| 49101.85946706944, | |
| 50934.22606007381, | |
| 50844.54285479484, | |
| 50726.18721081179, | |
| 51097.34570105861, | |
| 50962.02586836047, | |
| 47722.598010532995, | |
| 47396.27696404345, | |
| 47092.11075726091, | |
| 46422.82421829218, | |
| 47506.77271139331, | |
| 47406.93841683391, | |
| 46280.98326476368, | |
| 46164.78138780403, | |
| 43265.68419748686, | |
| 43275.913391207716, | |
| 41585.022892259345, | |
| 42003.66945857541, | |
| 42218.57126578665, | |
| 41656.505042558805, | |
| 42836.282931337686, | |
| 43933.94798971295, | |
| 42641.77574380057, | |
| 43433.83319474636, | |
| 43380.2020194891 | |
| ], | |
| "high": [ | |
| 48587.51338921172, | |
| 47961.12375469734, | |
| 47337.122321658026, | |
| 48055.74768990328, | |
| 47446.94044903319, | |
| 49341.61801683935, | |
| 49716.031099945765, | |
| 51290.70450858861, | |
| 51792.35925373034, | |
| 51208.60100307716, | |
| 51097.34570105861, | |
| 51956.630209564806, | |
| 50774.067814743, | |
| 48197.198418057065, | |
| 47944.91401310498, | |
| 48634.694886516525, | |
| 48033.24524853784, | |
| 47861.45540520053, | |
| 47503.7562114244, | |
| 47507.693656884665, | |
| 46928.9216580707, | |
| 43847.688673129465, | |
| 43216.45867693359, | |
| 42240.08706720382, | |
| 42755.76334790146, | |
| 42409.43949411891, | |
| 43161.26720258187, | |
| 44142.95617046611, | |
| 44046.08436602141, | |
| 43494.76826815796, | |
| 43495.44513376632 | |
| ], | |
| "low": [ | |
| 47869.71735116278, | |
| 45916.30185423912, | |
| 45826.54707719198, | |
| 46598.200656116576, | |
| 45723.105158529055, | |
| 47046.020323027784, | |
| 48886.99055366998, | |
| 48316.72416646556, | |
| 50844.54285479484, | |
| 50685.00622673602, | |
| 49789.473916292096, | |
| 50621.897547035995, | |
| 47618.19159481016, | |
| 46961.79972269094, | |
| 46574.822812744154, | |
| 45921.91045525004, | |
| 46319.65108805251, | |
| 46756.895153819445, | |
| 45966.43984703932, | |
| 45794.698823411105, | |
| 43265.68419748686, | |
| 42703.36056443185, | |
| 41119.024408424884, | |
| 40655.24908589081, | |
| 41558.21781001086, | |
| 40683.26965807297, | |
| 41628.0329959911, | |
| 42590.282253812686, | |
| 42641.77574380057, | |
| 42024.69661257974, | |
| 42669.96652910112 | |
| ], | |
| "open": [ | |
| 48587.51338921172, | |
| 47694.530502251764, | |
| 46328.6963654447, | |
| 46970.057050727024, | |
| 46807.04861642627, | |
| 47117.008204210455, | |
| 49058.23886266777, | |
| 48755.89564404483, | |
| 50927.61393294162, | |
| 50888.72103678683, | |
| 50478.270127814576, | |
| 50868.792929154675, | |
| 50774.067814743, | |
| 47725.14804631933, | |
| 46574.822812744154, | |
| 47191.86838983951, | |
| 46319.65108805251, | |
| 47816.07767640849, | |
| 47371.10779061876, | |
| 46531.140860530526, | |
| 45938.02427172366, | |
| 43526.03699363513, | |
| 43216.45867693359, | |
| 41527.197042644846, | |
| 41756.66232397826, | |
| 41862.3609856517, | |
| 41890.545239659165, | |
| 42811.149099488095, | |
| 43981.87732717414, | |
| 42608.41001195019, | |
| 43191.97077835075 | |
| ], | |
| "type": "candlestick", | |
| "x": [ | |
| "2021-12-16", | |
| "2021-12-17", | |
| "2021-12-18", | |
| "2021-12-19", | |
| "2021-12-20", | |
| "2021-12-21", | |
| "2021-12-22", | |
| "2021-12-23", | |
| "2021-12-24", | |
| "2021-12-25", | |
| "2021-12-26", | |
| "2021-12-27", | |
| "2021-12-28", | |
| "2021-12-29", | |
| "2021-12-30", | |
| "2021-12-31", | |
| "2022-01-01", | |
| "2022-01-02", | |
| "2022-01-03", | |
| "2022-01-04", | |
| "2022-01-05", | |
| "2022-01-06", | |
| "2022-01-07", | |
| "2022-01-08", | |
| "2022-01-09", | |
| "2022-01-10", | |
| "2022-01-11", | |
| "2022-01-12", | |
| "2022-01-13", | |
| "2022-01-14", | |
| "2022-01-15" | |
| ] | |
| } | |
| ], | |
| "layout": { | |
| "template": { | |
| "data": { | |
| "bar": [ | |
| { | |
| "error_x": { | |
| "color": "#2a3f5f" | |
| }, | |
| "error_y": { | |
| "color": "#2a3f5f" | |
| }, | |
| "marker": { | |
| "line": { | |
| "color": "#E5ECF6", | |
| "width": 0.5 | |
| } | |
| }, | |
| "type": "bar" | |
| } | |
| ], | |
| "barpolar": [ | |
| { | |
| "marker": { | |
| "line": { | |
| "color": "#E5ECF6", | |
| "width": 0.5 | |
| } | |
| }, | |
| "type": "barpolar" | |
| } | |
| ], | |
| "carpet": [ | |
| { | |
| "aaxis": { | |
| "endlinecolor": "#2a3f5f", | |
| "gridcolor": "white", | |
| "linecolor": "white", | |
| "minorgridcolor": "white", | |
| "startlinecolor": "#2a3f5f" | |
| }, | |
| "baxis": { | |
| "endlinecolor": "#2a3f5f", | |
| "gridcolor": "white", | |
| "linecolor": "white", | |
| "minorgridcolor": "white", | |
| "startlinecolor": "#2a3f5f" | |
| }, | |
| "type": "carpet" | |
| } | |
| ], | |
| "choropleth": [ | |
| { | |
| "colorbar": { | |
| "outlinewidth": 0, | |
| "ticks": "" | |
| }, | |
| "type": "choropleth" | |
| } | |
| ], | |
| "contour": [ | |
| { | |
| "colorbar": { | |
| "outlinewidth": 0, | |
| "ticks": "" | |
| }, | |
| "colorscale": [ | |
| [ | |
| 0, | |
| "#0d0887" | |
| ], | |
| [ | |
| 0.1111111111111111, | |
| "#46039f" | |
| ], | |
| [ | |
| 0.2222222222222222, | |
| "#7201a8" | |
| ], | |
| [ | |
| 0.3333333333333333, | |
| "#9c179e" | |
| ], | |
| [ | |
| 0.4444444444444444, | |
| "#bd3786" | |
| ], | |
| [ | |
| 0.5555555555555556, | |
| "#d8576b" | |
| ], | |
| [ | |
| 0.6666666666666666, | |
| "#ed7953" | |
| ], | |
| [ | |
| 0.7777777777777778, | |
| "#fb9f3a" | |
| ], | |
| [ | |
| 0.8888888888888888, | |
| "#fdca26" | |
| ], | |
| [ | |
| 1, | |
| "#f0f921" | |
| ] | |
| ], | |
| "type": "contour" | |
| } | |
| ], | |
| "contourcarpet": [ | |
| { | |
| "colorbar": { | |
| "outlinewidth": 0, | |
| "ticks": "" | |
| }, | |
| "type": "contourcarpet" | |
| } | |
| ], | |
| "heatmap": [ | |
| { | |
| "colorbar": { | |
| "outlinewidth": 0, | |
| "ticks": "" | |
| }, | |
| "colorscale": [ | |
| [ | |
| 0, | |
| "#0d0887" | |
| ], | |
| [ | |
| 0.1111111111111111, | |
| "#46039f" | |
| ], | |
| [ | |
| 0.2222222222222222, | |
| "#7201a8" | |
| ], | |
| [ | |
| 0.3333333333333333, | |
| "#9c179e" | |
| ], | |
| [ | |
| 0.4444444444444444, | |
| "#bd3786" | |
| ], | |
| [ | |
| 0.5555555555555556, | |
| "#d8576b" | |
| ], | |
| [ | |
| 0.6666666666666666, | |
| "#ed7953" | |
| ], | |
| [ | |
| 0.7777777777777778, | |
| "#fb9f3a" | |
| ], | |
| [ | |
| 0.8888888888888888, | |
| "#fdca26" | |
| ], | |
| [ | |
| 1, | |
| "#f0f921" | |
| ] | |
| ], | |
| "type": "heatmap" | |
| } | |
| ], | |
| "heatmapgl": [ | |
| { | |
| "colorbar": { | |
| "outlinewidth": 0, | |
| "ticks": "" | |
| }, | |
| "colorscale": [ | |
| [ | |
| 0, | |
| "#0d0887" | |
| ], | |
| [ | |
| 0.1111111111111111, | |
| "#46039f" | |
| ], | |
| [ | |
| 0.2222222222222222, | |
| "#7201a8" | |
| ], | |
| [ | |
| 0.3333333333333333, | |
| "#9c179e" | |
| ], | |
| [ | |
| 0.4444444444444444, | |
| "#bd3786" | |
| ], | |
| [ | |
| 0.5555555555555556, | |
| "#d8576b" | |
| ], | |
| [ | |
| 0.6666666666666666, | |
| "#ed7953" | |
| ], | |
| [ | |
| 0.7777777777777778, | |
| "#fb9f3a" | |
| ], | |
| [ | |
| 0.8888888888888888, | |
| "#fdca26" | |
| ], | |
| [ | |
| 1, | |
| "#f0f921" | |
| ] | |
| ], | |
| "type": "heatmapgl" | |
| } | |
| ], | |
| "histogram": [ | |
| { | |
| "marker": { | |
| "colorbar": { | |
| "outlinewidth": 0, | |
| "ticks": "" | |
| } | |
| }, | |
| "type": "histogram" | |
| } | |
| ], | |
| "histogram2d": [ | |
| { | |
| "colorbar": { | |
| "outlinewidth": 0, | |
| "ticks": "" | |
| }, | |
| "colorscale": [ | |
| [ | |
| 0, | |
| "#0d0887" | |
| ], | |
| [ | |
| 0.1111111111111111, | |
| "#46039f" | |
| ], | |
| [ | |
| 0.2222222222222222, | |
| "#7201a8" | |
| ], | |
| [ | |
| 0.3333333333333333, | |
| "#9c179e" | |
| ], | |
| [ | |
| 0.4444444444444444, | |
| "#bd3786" | |
| ], | |
| [ | |
| 0.5555555555555556, | |
| "#d8576b" | |
| ], | |
| [ | |
| 0.6666666666666666, | |
| "#ed7953" | |
| ], | |
| [ | |
| 0.7777777777777778, | |
| "#fb9f3a" | |
| ], | |
| [ | |
| 0.8888888888888888, | |
| "#fdca26" | |
| ], | |
| [ | |
| 1, | |
| "#f0f921" | |
| ] | |
| ], | |
| "type": "histogram2d" | |
| } | |
| ], | |
| "histogram2dcontour": [ | |
| { | |
| "colorbar": { | |
| "outlinewidth": 0, | |
| "ticks": "" | |
| }, | |
| "colorscale": [ | |
| [ | |
| 0, | |
| "#0d0887" | |
| ], | |
| [ | |
| 0.1111111111111111, | |
| "#46039f" | |
| ], | |
| [ | |
| 0.2222222222222222, | |
| "#7201a8" | |
| ], | |
| [ | |
| 0.3333333333333333, | |
| "#9c179e" | |
| ], | |
| [ | |
| 0.4444444444444444, | |
| "#bd3786" | |
| ], | |
| [ | |
| 0.5555555555555556, | |
| "#d8576b" | |
| ], | |
| [ | |
| 0.6666666666666666, | |
| "#ed7953" | |
| ], | |
| [ | |
| 0.7777777777777778, | |
| "#fb9f3a" | |
| ], | |
| [ | |
| 0.8888888888888888, | |
| "#fdca26" | |
| ], | |
| [ | |
| 1, | |
| "#f0f921" | |
| ] | |
| ], | |
| "type": "histogram2dcontour" | |
| } | |
| ], | |
| "mesh3d": [ | |
| { | |
| "colorbar": { | |
| "outlinewidth": 0, | |
| "ticks": "" | |
| }, | |
| "type": "mesh3d" | |
| } | |
| ], | |
| "parcoords": [ | |
| { | |
| "line": { | |
| "colorbar": { | |
| "outlinewidth": 0, | |
| "ticks": "" | |
| } | |
| }, | |
| "type": "parcoords" | |
| } | |
| ], | |
| "pie": [ | |
| { | |
| "automargin": true, | |
| "type": "pie" | |
| } | |
| ], | |
| "scatter": [ | |
| { | |
| "marker": { | |
| "colorbar": { | |
| "outlinewidth": 0, | |
| "ticks": "" | |
| } | |
| }, | |
| "type": "scatter" | |
| } | |
| ], | |
| "scatter3d": [ | |
| { | |
| "line": { | |
| "colorbar": { | |
| "outlinewidth": 0, | |
| "ticks": "" | |
| } | |
| }, | |
| "marker": { | |
| "colorbar": { | |
| "outlinewidth": 0, | |
| "ticks": "" | |
| } | |
| }, | |
| "type": "scatter3d" | |
| } | |
| ], | |
| "scattercarpet": [ | |
| { | |
| "marker": { | |
| "colorbar": { | |
| "outlinewidth": 0, | |
| "ticks": "" | |
| } | |
| }, | |
| "type": "scattercarpet" | |
| } | |
| ], | |
| "scattergeo": [ | |
| { | |
| "marker": { | |
| "colorbar": { | |
| "outlinewidth": 0, | |
| "ticks": "" | |
| } | |
| }, | |
| "type": "scattergeo" | |
| } | |
| ], | |
| "scattergl": [ | |
| { | |
| "marker": { | |
| "colorbar": { | |
| "outlinewidth": 0, | |
| "ticks": "" | |
| } | |
| }, | |
| "type": "scattergl" | |
| } | |
| ], | |
| "scattermapbox": [ | |
| { | |
| "marker": { | |
| "colorbar": { | |
| "outlinewidth": 0, | |
| "ticks": "" | |
| } | |
| }, | |
| "type": "scattermapbox" | |
| } | |
| ], | |
| "scatterpolar": [ | |
| { | |
| "marker": { | |
| "colorbar": { | |
| "outlinewidth": 0, | |
| "ticks": "" | |
| } | |
| }, | |
| "type": "scatterpolar" | |
| } | |
| ], | |
| "scatterpolargl": [ | |
| { | |
| "marker": { | |
| "colorbar": { | |
| "outlinewidth": 0, | |
| "ticks": "" | |
| } | |
| }, | |
| "type": "scatterpolargl" | |
| } | |
| ], | |
| "scatterternary": [ | |
| { | |
| "marker": { | |
| "colorbar": { | |
| "outlinewidth": 0, | |
| "ticks": "" | |
| } | |
| }, | |
| "type": "scatterternary" | |
| } | |
| ], | |
| "surface": [ | |
| { | |
| "colorbar": { | |
| "outlinewidth": 0, | |
| "ticks": "" | |
| }, | |
| "colorscale": [ | |
| [ | |
| 0, | |
| "#0d0887" | |
| ], | |
| [ | |
| 0.1111111111111111, | |
| "#46039f" | |
| ], | |
| [ | |
| 0.2222222222222222, | |
| "#7201a8" | |
| ], | |
| [ | |
| 0.3333333333333333, | |
| "#9c179e" | |
| ], | |
| [ | |
| 0.4444444444444444, | |
| "#bd3786" | |
| ], | |
| [ | |
| 0.5555555555555556, | |
| "#d8576b" | |
| ], | |
| [ | |
| 0.6666666666666666, | |
| "#ed7953" | |
| ], | |
| [ | |
| 0.7777777777777778, | |
| "#fb9f3a" | |
| ], | |
| [ | |
| 0.8888888888888888, | |
| "#fdca26" | |
| ], | |
| [ | |
| 1, | |
| "#f0f921" | |
| ] | |
| ], | |
| "type": "surface" | |
| } | |
| ], | |
| "table": [ | |
| { | |
| "cells": { | |
| "fill": { | |
| "color": "#EBF0F8" | |
| }, | |
| "line": { | |
| "color": "white" | |
| } | |
| }, | |
| "header": { | |
| "fill": { | |
| "color": "#C8D4E3" | |
| }, | |
| "line": { | |
| "color": "white" | |
| } | |
| }, | |
| "type": "table" | |
| } | |
| ] | |
| }, | |
| "layout": { | |
| "annotationdefaults": { | |
| "arrowcolor": "#2a3f5f", | |
| "arrowhead": 0, | |
| "arrowwidth": 1 | |
| }, | |
| "autotypenumbers": "strict", | |
| "coloraxis": { | |
| "colorbar": { | |
| "outlinewidth": 0, | |
| "ticks": "" | |
| } | |
| }, | |
| "colorscale": { | |
| "diverging": [ | |
| [ | |
| 0, | |
| "#8e0152" | |
| ], | |
| [ | |
| 0.1, | |
| "#c51b7d" | |
| ], | |
| [ | |
| 0.2, | |
| "#de77ae" | |
| ], | |
| [ | |
| 0.3, | |
| "#f1b6da" | |
| ], | |
| [ | |
| 0.4, | |
| "#fde0ef" | |
| ], | |
| [ | |
| 0.5, | |
| "#f7f7f7" | |
| ], | |
| [ | |
| 0.6, | |
| "#e6f5d0" | |
| ], | |
| [ | |
| 0.7, | |
| "#b8e186" | |
| ], | |
| [ | |
| 0.8, | |
| "#7fbc41" | |
| ], | |
| [ | |
| 0.9, | |
| "#4d9221" | |
| ], | |
| [ | |
| 1, | |
| "#276419" | |
| ] | |
| ], | |
| "sequential": [ | |
| [ | |
| 0, | |
| "#0d0887" | |
| ], | |
| [ | |
| 0.1111111111111111, | |
| "#46039f" | |
| ], | |
| [ | |
| 0.2222222222222222, | |
| "#7201a8" | |
| ], | |
| [ | |
| 0.3333333333333333, | |
| "#9c179e" | |
| ], | |
| [ | |
| 0.4444444444444444, | |
| "#bd3786" | |
| ], | |
| [ | |
| 0.5555555555555556, | |
| "#d8576b" | |
| ], | |
| [ | |
| 0.6666666666666666, | |
| "#ed7953" | |
| ], | |
| [ | |
| 0.7777777777777778, | |
| "#fb9f3a" | |
| ], | |
| [ | |
| 0.8888888888888888, | |
| "#fdca26" | |
| ], | |
| [ | |
| 1, | |
| "#f0f921" | |
| ] | |
| ], | |
| "sequentialminus": [ | |
| [ | |
| 0, | |
| "#0d0887" | |
| ], | |
| [ | |
| 0.1111111111111111, | |
| "#46039f" | |
| ], | |
| [ | |
| 0.2222222222222222, | |
| "#7201a8" | |
| ], | |
| [ | |
| 0.3333333333333333, | |
| "#9c179e" | |
| ], | |
| [ | |
| 0.4444444444444444, | |
| "#bd3786" | |
| ], | |
| [ | |
| 0.5555555555555556, | |
| "#d8576b" | |
| ], | |
| [ | |
| 0.6666666666666666, | |
| "#ed7953" | |
| ], | |
| [ | |
| 0.7777777777777778, | |
| "#fb9f3a" | |
| ], | |
| [ | |
| 0.8888888888888888, | |
| "#fdca26" | |
| ], | |
| [ | |
| 1, | |
| "#f0f921" | |
| ] | |
| ] | |
| }, | |
| "colorway": [ | |
| "#636efa", | |
| "#EF553B", | |
| "#00cc96", | |
| "#ab63fa", | |
| "#FFA15A", | |
| "#19d3f3", | |
| "#FF6692", | |
| "#B6E880", | |
| "#FF97FF", | |
| "#FECB52" | |
| ], | |
| "font": { | |
| "color": "#2a3f5f" | |
| }, | |
| "geo": { | |
| "bgcolor": "white", | |
| "lakecolor": "white", | |
| "landcolor": "#E5ECF6", | |
| "showlakes": true, | |
| "showland": true, | |
| "subunitcolor": "white" | |
| }, | |
| "hoverlabel": { | |
| "align": "left" | |
| }, | |
| "hovermode": "closest", | |
| "mapbox": { | |
| "style": "light" | |
| }, | |
| "paper_bgcolor": "white", | |
| "plot_bgcolor": "#E5ECF6", | |
| "polar": { | |
| "angularaxis": { | |
| "gridcolor": "white", | |
| "linecolor": "white", | |
| "ticks": "" | |
| }, | |
| "bgcolor": "#E5ECF6", | |
| "radialaxis": { | |
| "gridcolor": "white", | |
| "linecolor": "white", | |
| "ticks": "" | |
| } | |
| }, | |
| "scene": { | |
| "xaxis": { | |
| "backgroundcolor": "#E5ECF6", | |
| "gridcolor": "white", | |
| "gridwidth": 2, | |
| "linecolor": "white", | |
| "showbackground": true, | |
| "ticks": "", | |
| "zerolinecolor": "white" | |
| }, | |
| "yaxis": { | |
| "backgroundcolor": "#E5ECF6", | |
| "gridcolor": "white", | |
| "gridwidth": 2, | |
| "linecolor": "white", | |
| "showbackground": true, | |
| "ticks": "", | |
| "zerolinecolor": "white" | |
| }, | |
| "zaxis": { | |
| "backgroundcolor": "#E5ECF6", | |
| "gridcolor": "white", | |
| "gridwidth": 2, | |
| "linecolor": "white", | |
| "showbackground": true, | |
| "ticks": "", | |
| "zerolinecolor": "white" | |
| } | |
| }, | |
| "shapedefaults": { | |
| "line": { | |
| "color": "#2a3f5f" | |
| } | |
| }, | |
| "ternary": { | |
| "aaxis": { | |
| "gridcolor": "white", | |
| "linecolor": "white", | |
| "ticks": "" | |
| }, | |
| "baxis": { | |
| "gridcolor": "white", | |
| "linecolor": "white", | |
| "ticks": "" | |
| }, | |
| "bgcolor": "#E5ECF6", | |
| "caxis": { | |
| "gridcolor": "white", | |
| "linecolor": "white", | |
| "ticks": "" | |
| } | |
| }, | |
| "title": { | |
| "x": 0.05 | |
| }, | |
| "xaxis": { | |
| "automargin": true, | |
| "gridcolor": "white", | |
| "linecolor": "white", | |
| "ticks": "", | |
| "title": { | |
| "standoff": 15 | |
| }, | |
| "zerolinecolor": "white", | |
| "zerolinewidth": 2 | |
| }, | |
| "yaxis": { | |
| "automargin": true, | |
| "gridcolor": "white", | |
| "linecolor": "white", | |
| "ticks": "", | |
| "title": { | |
| "standoff": 15 | |
| }, | |
| "zerolinecolor": "white", | |
| "zerolinewidth": 2 | |
| } | |
| } | |
| }, | |
| "xaxis": { | |
| "rangeslider": { | |
| "visible": false | |
| } | |
| } | |
| } | |
| }, | |
| "text/html": "<div> <div id=\"999226c7-c2a2-4ea7-9fcf-bb2e12c99466\" class=\"plotly-graph-div\" style=\"height:525px; width:100%;\"></div> <script type=\"text/javascript\"> require([\"plotly\"], function(Plotly) { window.PLOTLYENV=window.PLOTLYENV || {}; if (document.getElementById(\"999226c7-c2a2-4ea7-9fcf-bb2e12c99466\")) { Plotly.newPlot( \"999226c7-c2a2-4ea7-9fcf-bb2e12c99466\", [{\"close\": [47990.49542321248, 46507.965042542106, 46841.49510619506, 47519.78023498492, 47033.22355853823, 49341.61801683935, 49101.85946706944, 50934.22606007381, 50844.54285479484, 50726.18721081179, 51097.34570105861, 50962.02586836047, 47722.598010532995, 47396.27696404345, 47092.11075726091, 46422.82421829218, 47506.77271139331, 47406.93841683391, 46280.98326476368, 46164.78138780403, 43265.68419748686, 43275.913391207716, 41585.022892259345, 42003.66945857541, 42218.57126578665, 41656.505042558805, 42836.282931337686, 43933.94798971295, 42641.77574380057, 43433.83319474636, 43380.2020194891], \"high\": [48587.51338921172, 47961.12375469734, 47337.122321658026, 48055.74768990328, 47446.94044903319, 49341.61801683935, 49716.031099945765, 51290.70450858861, 51792.35925373034, 51208.60100307716, 51097.34570105861, 51956.630209564806, 50774.067814743, 48197.198418057065, 47944.91401310498, 48634.694886516525, 48033.24524853784, 47861.45540520053, 47503.7562114244, 47507.693656884665, 46928.9216580707, 43847.688673129465, 43216.45867693359, 42240.08706720382, 42755.76334790146, 42409.43949411891, 43161.26720258187, 44142.95617046611, 44046.08436602141, 43494.76826815796, 43495.44513376632], \"low\": [47869.71735116278, 45916.30185423912, 45826.54707719198, 46598.200656116576, 45723.105158529055, 47046.020323027784, 48886.99055366998, 48316.72416646556, 50844.54285479484, 50685.00622673602, 49789.473916292096, 50621.897547035995, 47618.19159481016, 46961.79972269094, 46574.822812744154, 45921.91045525004, 46319.65108805251, 46756.895153819445, 45966.43984703932, 45794.698823411105, 43265.68419748686, 42703.36056443185, 41119.024408424884, 40655.24908589081, 41558.21781001086, 40683.26965807297, 41628.0329959911, 42590.282253812686, 42641.77574380057, 42024.69661257974, 42669.96652910112], \"open\": [48587.51338921172, 47694.530502251764, 46328.6963654447, 46970.057050727024, 46807.04861642627, 47117.008204210455, 49058.23886266777, 48755.89564404483, 50927.61393294162, 50888.72103678683, 50478.270127814576, 50868.792929154675, 50774.067814743, 47725.14804631933, 46574.822812744154, 47191.86838983951, 46319.65108805251, 47816.07767640849, 47371.10779061876, 46531.140860530526, 45938.02427172366, 43526.03699363513, 43216.45867693359, 41527.197042644846, 41756.66232397826, 41862.3609856517, 41890.545239659165, 42811.149099488095, 43981.87732717414, 42608.41001195019, 43191.97077835075], \"type\": \"candlestick\", \"x\": [\"2021-12-16\", \"2021-12-17\", \"2021-12-18\", \"2021-12-19\", \"2021-12-20\", \"2021-12-21\", \"2021-12-22\", \"2021-12-23\", \"2021-12-24\", \"2021-12-25\", \"2021-12-26\", \"2021-12-27\", \"2021-12-28\", \"2021-12-29\", \"2021-12-30\", \"2021-12-31\", \"2022-01-01\", \"2022-01-02\", \"2022-01-03\", \"2022-01-04\", \"2022-01-05\", \"2022-01-06\", \"2022-01-07\", \"2022-01-08\", \"2022-01-09\", \"2022-01-10\", \"2022-01-11\", \"2022-01-12\", \"2022-01-13\", \"2022-01-14\", \"2022-01-15\"]}], {\"template\": {\"data\": {\"bar\": [{\"error_x\": {\"color\": \"#2a3f5f\"}, \"error_y\": {\"color\": \"#2a3f5f\"}, \"marker\": {\"line\": {\"color\": \"#E5ECF6\", \"width\": 0.5}}, \"type\": \"bar\"}], \"barpolar\": [{\"marker\": {\"line\": {\"color\": \"#E5ECF6\", \"width\": 0.5}}, \"type\": \"barpolar\"}], \"carpet\": [{\"aaxis\": {\"endlinecolor\": \"#2a3f5f\", \"gridcolor\": \"white\", \"linecolor\": \"white\", \"minorgridcolor\": \"white\", \"startlinecolor\": \"#2a3f5f\"}, \"baxis\": {\"endlinecolor\": \"#2a3f5f\", \"gridcolor\": \"white\", \"linecolor\": \"white\", \"minorgridcolor\": \"white\", \"startlinecolor\": \"#2a3f5f\"}, \"type\": \"carpet\"}], \"choropleth\": [{\"colorbar\": {\"outlinewidth\": 0, \"ticks\": \"\"}, \"type\": \"choropleth\"}], \"contour\": [{\"colorbar\": {\"outlinewidth\": 0, \"ticks\": \"\"}, \"colorscale\": [[0.0, \"#0d0887\"], [0.1111111111111111, \"#46039f\"], [0.2222222222222222, \"#7201a8\"], [0.3333333333333333, \"#9c179e\"], [0.4444444444444444, \"#bd3786\"], [0.5555555555555556, \"#d8576b\"], [0.6666666666666666, \"#ed7953\"], [0.7777777777777778, \"#fb9f3a\"], [0.8888888888888888, \"#fdca26\"], [1.0, \"#f0f921\"]], \"type\": \"contour\"}], \"contourcarpet\": [{\"colorbar\": {\"outlinewidth\": 0, \"ticks\": \"\"}, \"type\": \"contourcarpet\"}], \"heatmap\": [{\"colorbar\": {\"outlinewidth\": 0, \"ticks\": \"\"}, \"colorscale\": [[0.0, \"#0d0887\"], [0.1111111111111111, \"#46039f\"], [0.2222222222222222, \"#7201a8\"], [0.3333333333333333, \"#9c179e\"], [0.4444444444444444, \"#bd3786\"], [0.5555555555555556, \"#d8576b\"], [0.6666666666666666, \"#ed7953\"], [0.7777777777777778, \"#fb9f3a\"], [0.8888888888888888, \"#fdca26\"], [1.0, \"#f0f921\"]], \"type\": \"heatmap\"}], \"heatmapgl\": [{\"colorbar\": {\"outlinewidth\": 0, \"ticks\": \"\"}, \"colorscale\": [[0.0, \"#0d0887\"], [0.1111111111111111, \"#46039f\"], [0.2222222222222222, \"#7201a8\"], [0.3333333333333333, \"#9c179e\"], [0.4444444444444444, \"#bd3786\"], [0.5555555555555556, \"#d8576b\"], [0.6666666666666666, \"#ed7953\"], [0.7777777777777778, \"#fb9f3a\"], [0.8888888888888888, \"#fdca26\"], [1.0, \"#f0f921\"]], \"type\": \"heatmapgl\"}], \"histogram\": [{\"marker\": {\"colorbar\": {\"outlinewidth\": 0, \"ticks\": \"\"}}, \"type\": \"histogram\"}], \"histogram2d\": [{\"colorbar\": {\"outlinewidth\": 0, \"ticks\": \"\"}, \"colorscale\": [[0.0, \"#0d0887\"], [0.1111111111111111, \"#46039f\"], [0.2222222222222222, \"#7201a8\"], [0.3333333333333333, \"#9c179e\"], [0.4444444444444444, \"#bd3786\"], [0.5555555555555556, \"#d8576b\"], [0.6666666666666666, \"#ed7953\"], [0.7777777777777778, \"#fb9f3a\"], [0.8888888888888888, \"#fdca26\"], [1.0, \"#f0f921\"]], \"type\": \"histogram2d\"}], \"histogram2dcontour\": [{\"colorbar\": {\"outlinewidth\": 0, \"ticks\": \"\"}, \"colorscale\": [[0.0, \"#0d0887\"], [0.1111111111111111, \"#46039f\"], [0.2222222222222222, \"#7201a8\"], [0.3333333333333333, \"#9c179e\"], [0.4444444444444444, \"#bd3786\"], [0.5555555555555556, \"#d8576b\"], [0.6666666666666666, \"#ed7953\"], [0.7777777777777778, \"#fb9f3a\"], [0.8888888888888888, \"#fdca26\"], [1.0, \"#f0f921\"]], \"type\": \"histogram2dcontour\"}], \"mesh3d\": [{\"colorbar\": {\"outlinewidth\": 0, \"ticks\": \"\"}, \"type\": \"mesh3d\"}], \"parcoords\": [{\"line\": {\"colorbar\": {\"outlinewidth\": 0, \"ticks\": \"\"}}, \"type\": \"parcoords\"}], \"pie\": [{\"automargin\": true, \"type\": \"pie\"}], \"scatter\": [{\"marker\": {\"colorbar\": {\"outlinewidth\": 0, \"ticks\": \"\"}}, \"type\": \"scatter\"}], \"scatter3d\": [{\"line\": {\"colorbar\": {\"outlinewidth\": 0, \"ticks\": \"\"}}, \"marker\": {\"colorbar\": {\"outlinewidth\": 0, \"ticks\": \"\"}}, \"type\": \"scatter3d\"}], \"scattercarpet\": [{\"marker\": {\"colorbar\": {\"outlinewidth\": 0, \"ticks\": \"\"}}, \"type\": \"scattercarpet\"}], \"scattergeo\": [{\"marker\": {\"colorbar\": {\"outlinewidth\": 0, \"ticks\": \"\"}}, \"type\": \"scattergeo\"}], \"scattergl\": [{\"marker\": {\"colorbar\": {\"outlinewidth\": 0, \"ticks\": \"\"}}, \"type\": \"scattergl\"}], \"scattermapbox\": [{\"marker\": {\"colorbar\": {\"outlinewidth\": 0, \"ticks\": \"\"}}, \"type\": \"scattermapbox\"}], \"scatterpolar\": [{\"marker\": {\"colorbar\": {\"outlinewidth\": 0, \"ticks\": \"\"}}, \"type\": \"scatterpolar\"}], \"scatterpolargl\": [{\"marker\": {\"colorbar\": {\"outlinewidth\": 0, \"ticks\": \"\"}}, \"type\": \"scatterpolargl\"}], \"scatterternary\": [{\"marker\": {\"colorbar\": {\"outlinewidth\": 0, \"ticks\": \"\"}}, \"type\": \"scatterternary\"}], \"surface\": [{\"colorbar\": {\"outlinewidth\": 0, \"ticks\": \"\"}, \"colorscale\": [[0.0, \"#0d0887\"], [0.1111111111111111, \"#46039f\"], [0.2222222222222222, \"#7201a8\"], [0.3333333333333333, \"#9c179e\"], [0.4444444444444444, \"#bd3786\"], [0.5555555555555556, \"#d8576b\"], [0.6666666666666666, \"#ed7953\"], [0.7777777777777778, \"#fb9f3a\"], [0.8888888888888888, \"#fdca26\"], [1.0, \"#f0f921\"]], \"type\": \"surface\"}], \"table\": [{\"cells\": {\"fill\": {\"color\": \"#EBF0F8\"}, \"line\": {\"color\": \"white\"}}, \"header\": {\"fill\": {\"color\": \"#C8D4E3\"}, \"line\": {\"color\": \"white\"}}, \"type\": \"table\"}]}, \"layout\": {\"annotationdefaults\": {\"arrowcolor\": \"#2a3f5f\", \"arrowhead\": 0, \"arrowwidth\": 1}, \"autotypenumbers\": \"strict\", \"coloraxis\": {\"colorbar\": {\"outlinewidth\": 0, \"ticks\": \"\"}}, \"colorscale\": {\"diverging\": [[0, \"#8e0152\"], [0.1, \"#c51b7d\"], [0.2, \"#de77ae\"], [0.3, \"#f1b6da\"], [0.4, \"#fde0ef\"], [0.5, \"#f7f7f7\"], [0.6, \"#e6f5d0\"], [0.7, \"#b8e186\"], [0.8, \"#7fbc41\"], [0.9, \"#4d9221\"], [1, \"#276419\"]], \"sequential\": [[0.0, \"#0d0887\"], [0.1111111111111111, \"#46039f\"], [0.2222222222222222, \"#7201a8\"], [0.3333333333333333, \"#9c179e\"], [0.4444444444444444, \"#bd3786\"], [0.5555555555555556, \"#d8576b\"], [0.6666666666666666, \"#ed7953\"], [0.7777777777777778, \"#fb9f3a\"], [0.8888888888888888, \"#fdca26\"], [1.0, \"#f0f921\"]], \"sequentialminus\": [[0.0, \"#0d0887\"], [0.1111111111111111, \"#46039f\"], [0.2222222222222222, \"#7201a8\"], [0.3333333333333333, \"#9c179e\"], [0.4444444444444444, \"#bd3786\"], [0.5555555555555556, \"#d8576b\"], [0.6666666666666666, \"#ed7953\"], [0.7777777777777778, \"#fb9f3a\"], [0.8888888888888888, \"#fdca26\"], [1.0, \"#f0f921\"]]}, \"colorway\": [\"#636efa\", \"#EF553B\", \"#00cc96\", \"#ab63fa\", \"#FFA15A\", \"#19d3f3\", \"#FF6692\", \"#B6E880\", \"#FF97FF\", \"#FECB52\"], \"font\": {\"color\": \"#2a3f5f\"}, \"geo\": {\"bgcolor\": \"white\", \"lakecolor\": \"white\", \"landcolor\": \"#E5ECF6\", \"showlakes\": true, \"showland\": true, \"subunitcolor\": \"white\"}, \"hoverlabel\": {\"align\": \"left\"}, \"hovermode\": \"closest\", \"mapbox\": {\"style\": \"light\"}, \"paper_bgcolor\": \"white\", \"plot_bgcolor\": \"#E5ECF6\", \"polar\": {\"angularaxis\": {\"gridcolor\": \"white\", \"linecolor\": \"white\", \"ticks\": \"\"}, \"bgcolor\": \"#E5ECF6\", \"radialaxis\": {\"gridcolor\": \"white\", \"linecolor\": \"white\", \"ticks\": \"\"}}, \"scene\": {\"xaxis\": {\"backgroundcolor\": \"#E5ECF6\", \"gridcolor\": \"white\", \"gridwidth\": 2, \"linecolor\": \"white\", \"showbackground\": true, \"ticks\": \"\", \"zerolinecolor\": \"white\"}, \"yaxis\": {\"backgroundcolor\": \"#E5ECF6\", \"gridcolor\": \"white\", \"gridwidth\": 2, \"linecolor\": \"white\", \"showbackground\": true, \"ticks\": \"\", \"zerolinecolor\": \"white\"}, \"zaxis\": {\"backgroundcolor\": \"#E5ECF6\", \"gridcolor\": \"white\", \"gridwidth\": 2, \"linecolor\": \"white\", \"showbackground\": true, \"ticks\": \"\", \"zerolinecolor\": \"white\"}}, \"shapedefaults\": {\"line\": {\"color\": \"#2a3f5f\"}}, \"ternary\": {\"aaxis\": {\"gridcolor\": \"white\", \"linecolor\": \"white\", \"ticks\": \"\"}, \"baxis\": {\"gridcolor\": \"white\", \"linecolor\": \"white\", \"ticks\": \"\"}, \"bgcolor\": \"#E5ECF6\", \"caxis\": {\"gridcolor\": \"white\", \"linecolor\": \"white\", \"ticks\": \"\"}}, \"title\": {\"x\": 0.05}, \"xaxis\": {\"automargin\": true, \"gridcolor\": \"white\", \"linecolor\": \"white\", \"ticks\": \"\", \"title\": {\"standoff\": 15}, \"zerolinecolor\": \"white\", \"zerolinewidth\": 2}, \"yaxis\": {\"automargin\": true, \"gridcolor\": \"white\", \"linecolor\": \"white\", \"ticks\": \"\", \"title\": {\"standoff\": 15}, \"zerolinecolor\": \"white\", \"zerolinewidth\": 2}}}, \"xaxis\": {\"rangeslider\": {\"visible\": false}}}, {\"responsive\": true} ).then(function(){\n \nvar gd = document.getElementById('999226c7-c2a2-4ea7-9fcf-bb2e12c99466');\nvar x = new MutationObserver(function (mutations, observer) {{\n var display = window.getComputedStyle(gd).display;\n if (!display || display === 'none') {{\n console.log([gd, 'removed!']);\n Plotly.purge(gd);\n observer.disconnect();\n }}\n}});\n\n// Listen for the removal of the full notebook cells\nvar notebookContainer = gd.closest('#notebook-container');\nif (notebookContainer) {{\n x.observe(notebookContainer, {childList: true});\n}}\n\n// Listen for the clearing of the current output cell\nvar outputEl = gd.closest('.output');\nif (outputEl) {{\n x.observe(outputEl, {childList: true});\n}}\n\n }) }; }); </script> </div>" | |
| }, | |
| "metadata": {} | |
| } | |
| ] | |
| }, | |
| { | |
| "metadata": {}, | |
| "cell_type": "markdown", | |
| "source": "## Authors:\n\n## Change Log\n\n| Date (YYYY-MM-DD) | Version | Changed By | Change Description |\n| ----------------- | ------- | ------------- | ---------------------------------- |\n| 2020-11-23 | 3.0 | Azim Hirjani | New API |\n| 2020-09-09 | 2.1 | Malika Singla | Spell Check |\n| 2020-08-26 | 2.0 | Lavanya | Moved lab to course repo in GitLab |\n| | | | |\n\n<hr/>\n\n## <h3 align=\"center\"> \u00a9 IBM Corporation 2020. All rights reserved. <h3/>\n" | |
| }, | |
| { | |
| "metadata": {}, | |
| "cell_type": "code", | |
| "source": "", | |
| "execution_count": null, | |
| "outputs": [] | |
| } | |
| ], | |
| "metadata": { | |
| "kernelspec": { | |
| "name": "python3", | |
| "display_name": "Python 3.8", | |
| "language": "python" | |
| }, | |
| "language_info": { | |
| "name": "python", | |
| "version": "3.8.12", | |
| "mimetype": "text/x-python", | |
| "codemirror_mode": { | |
| "name": "ipython", | |
| "version": 3 | |
| }, | |
| "pygments_lexer": "ipython3", | |
| "nbconvert_exporter": "python", | |
| "file_extension": ".py" | |
| } | |
| }, | |
| "nbformat": 4, | |
| "nbformat_minor": 4 | |
| } |
Sign up for free
to join this conversation on GitHub.
Already have an account?
Sign in to comment