Last active
August 29, 2015 14:19
-
-
Save psychemedia/fbcd7cf1daabe0004e27 to your computer and use it in GitHub Desktop.
Open Knowledge / Cabinet Office Code Club, week 8
This file contains bidirectional Unicode text that may be interpreted or compiled differently than what appears below. To review, open the file in an editor that reveals hidden Unicode characters.
Learn more about bidirectional Unicode characters
| { | |
| "metadata": { | |
| "name": "", | |
| "signature": "sha256:ebb68cc8ff4c725b03b0ca683d2121e5d131016822604087eac2e355b4e7ec0e" | |
| }, | |
| "nbformat": 3, | |
| "nbformat_minor": 0, | |
| "worksheets": [ | |
| { | |
| "cells": [ | |
| { | |
| "cell_type": "markdown", | |
| "metadata": {}, | |
| "source": [ | |
| "# Using Shapefiles and Generating Choropleth Maps\n", | |
| "\n", | |
| "Choropleth maps are maps in which well-defined regions of a map are coloured according to a particular indicator value.\n", | |
| "\n", | |
| "To generate such a map, we need three things:\n", | |
| "\n", | |
| "- a base map object;\n", | |
| "- one or more connected/closed boundary lines to describe the shape(s)/region(s)\n", | |
| "- an indicator whose value we can translate to a colour to fill a corresponding shape/region\n", | |
| "\n", | |
| "In terms of getting boundary lines, the *geojson* data format (`.json`, `.geojson`) is increasingly used as a lightweight standard for trasnporting geodata in web apps. Other formats include KML (`.kml`) and ESRI shapefiles (`.shp`)." | |
| ] | |
| }, | |
| { | |
| "cell_type": "markdown", | |
| "metadata": {}, | |
| "source": [ | |
| "## Sources of boundary lines\n", | |
| "\n", | |
| "One useful source of boundary line data for UK administrative boundaries is from the MySociety [MapIt](http://mapit.mysociety.org/) website/service.\n", | |
| "\n", | |
| "For example, we can identify a range of adminsitrative boundaries for the Isle of Wight by looking up the Isle of Wight Council postcode on MapIt: [PO30 1UD](http://mapit.mysociety.org/postcode/PO30%201UD.html).\n", | |
| "\n", | |
| "From there we can get a link to an adminstrative region, such as the [Isle of Wight parliamentary constituency](http://mapit.mysociety.org/area/65791.html). You can also use MapIt to find other regions, such as adjoining regions, or regions covered by or covering a particular area.\n", | |
| "\n", | |
| "We can then get the geometry file [as geojson](http://mapit.mysociety.org/area/65791.geojson) and render it using *folium*.\n", | |
| "\n", | |
| "Martin Chorley has collected together on Github a range of useful shapefiles in geojson and TopoJSON formats that describe various electoral boundaries [martinjc/UK-GeoJSON](https://github.com/martinjc/UK-GeoJSON)." | |
| ] | |
| }, | |
| { | |
| "cell_type": "code", | |
| "collapsed": false, | |
| "input": [ | |
| "#http://bit.ly/ccweek7code\n", | |
| "from IPython.display import HTML\n", | |
| "import folium\n", | |
| "\n", | |
| "def inline_map(map):\n", | |
| " \"\"\"\n", | |
| " Embeds the HTML source of the map directly into the IPython notebook.\n", | |
| " \n", | |
| " This method will not work if the map depends on any files (json data). Also this uses\n", | |
| " the HTML5 srcdoc attribute, which may not be supported in all browsers.\n", | |
| " \"\"\"\n", | |
| " map._build_map()\n", | |
| " return HTML('<iframe srcdoc=\"{srcdoc}\" style=\"width: 100%; height: 510px; border: none\"></iframe>'.format(srcdoc=map.HTML.replace('\"', '"')))\n", | |
| "\n", | |
| "def embed_map(map, path=\"map.html\"):\n", | |
| " \"\"\"\n", | |
| " Embeds a linked iframe to the map into the IPython notebook.\n", | |
| " \n", | |
| " Note: this method will not capture the source of the map into the notebook.\n", | |
| " This method should work for all maps (as long as they use relative urls).\n", | |
| " \"\"\"\n", | |
| " map.create_map(path=path)\n", | |
| " return HTML('<iframe src=\"files/{path}\" style=\"width: 100%; height: 510px; border: none\"></iframe>'.format(path=path))" | |
| ], | |
| "language": "python", | |
| "metadata": { | |
| "activity": false | |
| }, | |
| "outputs": [] | |
| }, | |
| { | |
| "cell_type": "code", | |
| "collapsed": false, | |
| "input": [ | |
| "geojson_url_iw='http://mapit.mysociety.org/area/65791.geojson'\n", | |
| "iw_map = folium.Map(location=[50.666, -1.37], zoom_start=11)\n", | |
| "iw_map.geo_json(geo_path= geojson_url_iw)\n", | |
| "embed_map(iw_map,'iw_map.html')" | |
| ], | |
| "language": "python", | |
| "metadata": { | |
| "activity": false | |
| }, | |
| "outputs": [] | |
| }, | |
| { | |
| "cell_type": "markdown", | |
| "metadata": {}, | |
| "source": [ | |
| "**See if you can map some other areas of different administrative type.**" | |
| ] | |
| }, | |
| { | |
| "cell_type": "markdown", | |
| "metadata": {}, | |
| "source": [ | |
| "As we did last week, we can patch a standalone HTML file containing the map created/saved using `embed_map()` with the following routine:" | |
| ] | |
| }, | |
| { | |
| "cell_type": "code", | |
| "collapsed": false, | |
| "input": [ | |
| "def patcher(fn='map.html'):\n", | |
| " f=open(fn,'r')\n", | |
| " html=f.read()\n", | |
| " f.close()\n", | |
| " html=html.replace('\"//','\"http://')\n", | |
| " f=open(fn,'w')\n", | |
| " f.write(html)\n", | |
| " f.close()\n", | |
| " \n", | |
| "patcher('iw_map.html')" | |
| ], | |
| "language": "python", | |
| "metadata": { | |
| "activity": false | |
| }, | |
| "outputs": [] | |
| }, | |
| { | |
| "cell_type": "markdown", | |
| "metadata": {}, | |
| "source": [ | |
| "### Colouring the regions\n", | |
| "You can play with the fill colour and transparency level of the data using the `fill_color` and `fill_opacity` parameters to the `.geo_json()` function." | |
| ] | |
| }, | |
| { | |
| "cell_type": "code", | |
| "collapsed": false, | |
| "input": [ | |
| "#We can also move up a level to the South East region (http://mapit.mysociety.org/area/11811.html) for example\n", | |
| "geojson_url_se='http://mapit.mysociety.org/area/11811.geojson'\n", | |
| "se_map = folium.Map(location=[51.4, -1], zoom_start=8)\n", | |
| "se_map.geo_json(geo_path= geojson_url_se,fill_color='green',fill_opacity=0.3)\n", | |
| "embed_map(se_map,'se_map.html')" | |
| ], | |
| "language": "python", | |
| "metadata": { | |
| "activity": false | |
| }, | |
| "outputs": [] | |
| }, | |
| { | |
| "cell_type": "markdown", | |
| "metadata": {}, | |
| "source": [ | |
| "**Experiment with various fill colour and transparency settings.**\n", | |
| "\n", | |
| "**How would you add additional regions to the map?**" | |
| ] | |
| }, | |
| { | |
| "cell_type": "code", | |
| "collapsed": false, | |
| "input": [ | |
| "#See if you can figure out how to add several regions to the map, perhaps with different colours...\n", | |
| "\n", | |
| "\n", | |
| "\n", | |
| "\n", | |
| "\n" | |
| ], | |
| "language": "python", | |
| "metadata": { | |
| "activity": false | |
| }, | |
| "outputs": [] | |
| }, | |
| { | |
| "cell_type": "code", | |
| "collapsed": false, | |
| "input": [ | |
| "#We can add additional layers to the map object, just as we added additional markers to the map last week\n", | |
| "#So for example, add an IW layer to the SE map...\n", | |
| "se_map.geo_json(geo_path= geojson_url_iw,fill_color='orange',fill_opacity=0.3)\n", | |
| "embed_map(se_map,'se_map.html')" | |
| ], | |
| "language": "python", | |
| "metadata": { | |
| "activity": false | |
| }, | |
| "outputs": [] | |
| }, | |
| { | |
| "cell_type": "markdown", | |
| "metadata": {}, | |
| "source": [ | |
| "If we look at the page for Newport - [http://mapit.mysociety.org/area/61005.html](http://mapit.mysociety.org/area/61005.html) - the \"county town\" of the Isle of Wight, we see that we can find a list of additional geographies covered by that region:[http://mapit.mysociety.org/area/61005/covers.html](http://mapit.mysociety.org/area/61005/covers.html?type=UTE).\n", | |
| "\n", | |
| "We can futher filter these to geographies of a particular type, for example:\n", | |
| "[http://mapit.mysociety.org/area/61005/covers.html?type=UTE](http://mapit.mysociety.org/area/61005/covers.html?type=UTE)\n", | |
| "\n", | |
| "We can also get this data back as JSON: http://mapit.mysociety.org/area/61005/covers?type=UTE" | |
| ] | |
| }, | |
| { | |
| "cell_type": "code", | |
| "collapsed": false, | |
| "input": [ | |
| "#Use the requests library to load the json data\n", | |
| "import requests\n", | |
| "import json\n", | |
| "\n", | |
| "regions='http://mapit.mysociety.org/area/61005/covers?type=UTE'\n", | |
| "jsondata=json.loads( requests.get(regions).content )\n", | |
| "jsondata" | |
| ], | |
| "language": "python", | |
| "metadata": { | |
| "activity": false | |
| }, | |
| "outputs": [] | |
| }, | |
| { | |
| "cell_type": "code", | |
| "collapsed": false, | |
| "input": [ | |
| "#We can iterate through the covered regions to grab their ids\n", | |
| "for key in jsondata:\n", | |
| " print(key)" | |
| ], | |
| "language": "python", | |
| "metadata": { | |
| "activity": false | |
| }, | |
| "outputs": [] | |
| }, | |
| { | |
| "cell_type": "markdown", | |
| "metadata": {}, | |
| "source": [ | |
| "**Can you think of a way of taking the Isle of Wight map (`iw_map` above) and adding to it white filled boundaries for the URE regions covered by Newport?**" | |
| ] | |
| }, | |
| { | |
| "cell_type": "code", | |
| "collapsed": false, | |
| "input": [ | |
| "#Using iw_map, try to add white colour filled shapes for each UTE region in Newport\n", | |
| "\n", | |
| "\n", | |
| "\n", | |
| "\n", | |
| "\n", | |
| "\n", | |
| "\n" | |
| ], | |
| "language": "python", | |
| "metadata": { | |
| "activity": false | |
| }, | |
| "outputs": [] | |
| }, | |
| { | |
| "cell_type": "code", | |
| "collapsed": false, | |
| "input": [ | |
| "for key in jsondata:\n", | |
| " tmp_url='http://mapit.mysociety.org/area/{}.geojson'.format(key)\n", | |
| " iw_map.geo_json(geo_path= tmp_url,fill_color='white',fill_opacity=1)\n", | |
| "\n", | |
| "embed_map(iw_map,'iw_map.html')" | |
| ], | |
| "language": "python", | |
| "metadata": { | |
| "activity": false | |
| }, | |
| "outputs": [] | |
| }, | |
| { | |
| "cell_type": "markdown", | |
| "metadata": {}, | |
| "source": [ | |
| "## Generating Choropleth Maps\n", | |
| "\n", | |
| "Something topical...\n", | |
| "\n", | |
| "Chris Hanretty et al. are making election forecasts based on aggregated poll data available at [electionforecast.co.uk](http://electionforecast.co.uk).\n", | |
| "\n", | |
| "The forecast data is published as an HTML table at [http://www.electionforecast.co.uk/tables/predicted_probability_by_seat.html](http://www.electionforecast.co.uk/tables/predicted_probability_by_seat.html).\n", | |
| "\n", | |
| "**HOW WOULD YOU LOAD THIS DATA INTO A PANDAS DATAFRAME? (HINT: do you remember how to use .read_html()?)**" | |
| ] | |
| }, | |
| { | |
| "cell_type": "code", | |
| "collapsed": false, | |
| "input": [ | |
| "#See if you can grab the data from http://www.electionforecast.co.uk/tables/predicted_probability_by_seat.html\n", | |
| "#into a pandas dataframe...\n", | |
| "\n", | |
| "\n", | |
| "\n", | |
| "\n", | |
| "\n", | |
| "\n", | |
| "\n", | |
| "\n", | |
| "\n" | |
| ], | |
| "language": "python", | |
| "metadata": { | |
| "activity": false | |
| }, | |
| "outputs": [] | |
| }, | |
| { | |
| "cell_type": "code", | |
| "collapsed": false, | |
| "input": [ | |
| "#We can grab the data into a data frame by scraping the tabular HTML data from the URL directly\n", | |
| "#The pandas .read_html() function can accept a URL and will return a list of tables scraped from the page\n", | |
| "\n", | |
| "import pandas as pd\n", | |
| "df=pd.read_html('http://www.electionforecast.co.uk/tables/predicted_probability_by_seat.html')\n", | |
| "\n", | |
| "#We index into the table list response to get the table we want...\n", | |
| "df[0][:3]" | |
| ], | |
| "language": "python", | |
| "metadata": { | |
| "activity": false | |
| }, | |
| "outputs": [] | |
| }, | |
| { | |
| "cell_type": "markdown", | |
| "metadata": {}, | |
| "source": [ | |
| "If you look at the election forecast data you wil see the official name of the constituency listed in the *Seat* column.\n", | |
| "\n", | |
| "Now let's grab some shapefiles corresponding to the Westminster consituencies." | |
| ] | |
| }, | |
| { | |
| "cell_type": "code", | |
| "collapsed": false, | |
| "input": [ | |
| "#Grab Westminster parliamentary constituency shapefiles from Martin Chorley's github repository\n", | |
| "import requests\n", | |
| "url='https://github.com/martinjc/UK-GeoJSON/blob/master/json/electoral/gb/wpc.json?raw=true'\n", | |
| "r = requests.get(url)\n", | |
| "\n", | |
| "#And save it to the local directory as the file wpc.json\n", | |
| "with open(\"wpc.json\", \"wb\") as code:\n", | |
| " code.write(r.content)\n", | |
| "\n", | |
| "#Free up memory...\n", | |
| "r=None" | |
| ], | |
| "language": "python", | |
| "metadata": { | |
| "activity": false | |
| }, | |
| "outputs": [] | |
| }, | |
| { | |
| "cell_type": "markdown", | |
| "metadata": {}, | |
| "source": [ | |
| "As well as setting `geo_path=URL`, we can also set `geo_path=LOCAL_FILE`.\n", | |
| "\n", | |
| "**See if you can plot a map showing the Westminster Parliamentary Constituency boundaries**\n", | |
| "\n", | |
| "Look at the documentation for more details. For example:" | |
| ] | |
| }, | |
| { | |
| "cell_type": "code", | |
| "collapsed": false, | |
| "input": [ | |
| "?iw_map.geo_json" | |
| ], | |
| "language": "python", | |
| "metadata": { | |
| "activity": false | |
| }, | |
| "outputs": [] | |
| }, | |
| { | |
| "cell_type": "code", | |
| "collapsed": false, | |
| "input": [ | |
| "#Now try plotting a map of UK Westminster Parliamentary Constituency boundaries\n", | |
| "\n", | |
| "\n", | |
| "\n", | |
| "\n" | |
| ], | |
| "language": "python", | |
| "metadata": { | |
| "activity": false | |
| }, | |
| "outputs": [] | |
| }, | |
| { | |
| "cell_type": "code", | |
| "collapsed": false, | |
| "input": [ | |
| "#Here's one way...\n", | |
| "\n", | |
| "#Create a base map\n", | |
| "wpc_map = folium.Map(location=[55, 0], zoom_start=5)\n", | |
| "\n", | |
| "wpc_map.geo_json(geo_path= \"wpc.json\",fill_color='orange',fill_opacity=0.3)\n", | |
| "embed_map(wpc_map,'wpc_map.html')" | |
| ], | |
| "language": "python", | |
| "metadata": { | |
| "activity": false | |
| }, | |
| "outputs": [] | |
| }, | |
| { | |
| "cell_type": "markdown", | |
| "metadata": {}, | |
| "source": [ | |
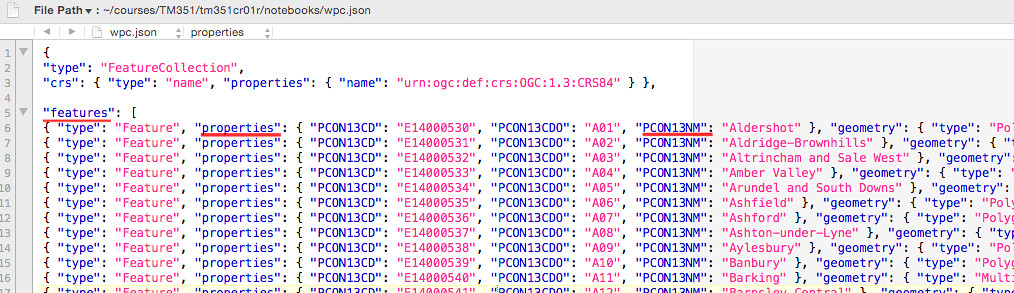
| "If you look at the structure of the *wpc.json* file, you will see that it takes the following form:\n", | |
| "\n", | |
| "\n", | |
| "\n", | |
| "That is, it contains a list of `features` each of which have a set of `properties` that includes one called `PCON13NM` that contains the parlimentary constituency name." | |
| ] | |
| }, | |
| { | |
| "cell_type": "code", | |
| "collapsed": false, | |
| "input": [ | |
| "wpc_map.geo_json(geo_path='wpc.json', data=df[0],data_out='data_lab.json', columns=['Seat', 'Labour'],\n", | |
| " key_on='feature.properties.PCON13NM',threshold_scale=[0, 20, 40, 60, 80, 100],\n", | |
| " fill_color='OrRd')\n", | |
| "embed_map(wpc_map)" | |
| ], | |
| "language": "python", | |
| "metadata": { | |
| "activity": false | |
| }, | |
| "outputs": [] | |
| }, | |
| { | |
| "cell_type": "markdown", | |
| "metadata": {}, | |
| "source": [ | |
| "**How would you create a map to show the likelihood of the Conservatives winning each seat?**" | |
| ] | |
| }, | |
| { | |
| "cell_type": "code", | |
| "collapsed": false, | |
| "input": [ | |
| "#Create a forecast map showing the likelihood of the Conservatives taking each seat\n", | |
| "#Use a different colour theme such as GnBu for the colour scale\n", | |
| "#Other colour schemes can be found from the library docmentation - http://folium.readthedocs.org/en/latest/\n", | |
| "\n", | |
| "\n", | |
| "\n", | |
| "\n" | |
| ], | |
| "language": "python", | |
| "metadata": { | |
| "activity": false | |
| }, | |
| "outputs": [] | |
| }, | |
| { | |
| "cell_type": "markdown", | |
| "metadata": {}, | |
| "source": [ | |
| "The folium library does not allow us to pass in discrete coloursor use a categorical mapping when binding data. Instead, if we wanted to plot a map that showed the colour of the most likely winner of a seat, we would need to:\n", | |
| "\n", | |
| "- reshape the data to find out the party most likely to take the seat (the one with the highet forecast value)\n", | |
| "- generate a colour mapping\n", | |
| "- iterate through each seat and plot the constituency separately." | |
| ] | |
| }, | |
| { | |
| "cell_type": "code", | |
| "collapsed": false, | |
| "input": [ | |
| "forecast_m =pd.melt(df[0], id_vars=['Seat','Region'],\n", | |
| " value_vars=['Conservatives','Labour','Liberal Democrats','SNP','Plaid Cymru','Greens','UKIP','Other'],\n", | |
| " var_name='Party', value_name='forecast')\n", | |
| "forecast_m[:3]" | |
| ], | |
| "language": "python", | |
| "metadata": { | |
| "activity": false | |
| }, | |
| "outputs": [] | |
| }, | |
| { | |
| "cell_type": "code", | |
| "collapsed": false, | |
| "input": [ | |
| "likelyparty=forecast_m.sort('forecast', ascending=False).groupby('Seat', as_index=False).first()\n", | |
| "likelyparty[:3]" | |
| ], | |
| "language": "python", | |
| "metadata": { | |
| "activity": false | |
| }, | |
| "outputs": [] | |
| }, | |
| { | |
| "cell_type": "code", | |
| "collapsed": false, | |
| "input": [ | |
| "partycolours={'Conservatives':'blue',\n", | |
| " 'Labour':'red',\n", | |
| " 'Liberal Democrats':'yellow',\n", | |
| " 'SNP':'orange',\n", | |
| " 'Plaid Cymru':'pink',\n", | |
| " 'Greens':'green',\n", | |
| " 'UKIP':'purple',\n", | |
| " 'Other':'black'}\n", | |
| "likelyparty['colour']=likelyparty['Party'].map(partycolours)\n", | |
| "likelyparty[:3]" | |
| ], | |
| "language": "python", | |
| "metadata": { | |
| "activity": false | |
| }, | |
| "outputs": [] | |
| }, | |
| { | |
| "cell_type": "markdown", | |
| "metadata": {}, | |
| "source": [ | |
| "The next thing we need to do is to be able to get hold of the shape information for each constituency. *folium* handled this for us automatically when we used the `.geo_json()` function, but this time we need to extract a separate boundary for each constituency.\n", | |
| "\n", | |
| "Note also that we can pass a geojson string into folium using `geo_str=GOEJSON_STRING` rather than passing in a filename or URL using `geo_path`." | |
| ] | |
| }, | |
| { | |
| "cell_type": "code", | |
| "collapsed": false, | |
| "input": [ | |
| "import json\n", | |
| "jj=json.load(open('wpc.json'))" | |
| ], | |
| "language": "python", | |
| "metadata": { | |
| "activity": false | |
| }, | |
| "outputs": [] | |
| }, | |
| { | |
| "cell_type": "code", | |
| "collapsed": false, | |
| "input": [ | |
| "for c in jj['features'][:3]:\n", | |
| " print(c['properties']['PCON13NM'])" | |
| ], | |
| "language": "python", | |
| "metadata": { | |
| "activity": false | |
| }, | |
| "outputs": [] | |
| }, | |
| { | |
| "cell_type": "code", | |
| "collapsed": false, | |
| "input": [ | |
| "likelyparty[likelyparty['Seat']=='Aberavon']" | |
| ], | |
| "language": "python", | |
| "metadata": { | |
| "activity": false | |
| }, | |
| "outputs": [] | |
| }, | |
| { | |
| "cell_type": "code", | |
| "collapsed": false, | |
| "input": [ | |
| "#If we convert the dataframe to a dict, we can lookup colour by seat\n", | |
| "#Set the index to be the seat, then we get a nested dict keyed at the top level by column and then by seat\n", | |
| "likelyparty_dict=likelyparty.set_index('Seat').to_dict()\n", | |
| "likelyparty_dict['colour']" | |
| ], | |
| "language": "python", | |
| "metadata": { | |
| "activity": false | |
| }, | |
| "outputs": [] | |
| }, | |
| { | |
| "cell_type": "code", | |
| "collapsed": false, | |
| "input": [ | |
| "#Can you remember how we added boundaries for areas in Newport to the Isle of Wight map...\n", | |
| "#The following approach uses a similar principle\n", | |
| "\n", | |
| "forecast_map = folium.Map(location=[55, 0], zoom_start=5)\n", | |
| "\n", | |
| "#Iterate through each constituency in the geojson file getting each feature (constituency shapefile) in turn\n", | |
| "for c in jj['features']:\n", | |
| " #The geojson format requires that features are provided in a list and a FeatureCollection defined as the type\n", | |
| " #So we wrap the feature definition for each constituency in the necessary format\n", | |
| " geodata= {\"type\": \"FeatureCollection\", \"features\": [c]}\n", | |
| " #Get the name of the seat for the current constituency\n", | |
| " seat=c['properties']['PCON13NM']\n", | |
| " #We can now lookup the colour \n", | |
| " colour= likelyparty_dict['colour'][seat]\n", | |
| " forecast_map.geo_json(geo_str= json.dumps(geodata),fill_color=colour,fill_opacity=1)\n", | |
| "\n", | |
| "embed_map(forecast_map,'forecast_map.html')" | |
| ], | |
| "language": "python", | |
| "metadata": { | |
| "activity": false | |
| }, | |
| "outputs": [] | |
| }, | |
| { | |
| "cell_type": "markdown", | |
| "metadata": {}, | |
| "source": [ | |
| "## Working With ESRI .shp Shapefiles\n", | |
| "\n", | |
| "*folium* makes working with maps using geojson relatively straightforward. However, if your shapefiles come in the form of ESRI `.shp` format files, *folium* cannot work with them directly.\n", | |
| "\n", | |
| "A workaround is to convert the `.shp` file to a geojson file for use directly in *folium*.\n", | |
| "\n", | |
| "The Python `shapefile` library (available as [pyshp](https://github.com/GeospatialPython/pyshp)) helps us do what we need.\n", | |
| "\n", | |
| "(Note that there are more powerful tools available for working with geo-data, including a *pandas* extension called *geopandas*, but many of them require additional non-python packages libraries installing on your computer before they can be used.)" | |
| ] | |
| }, | |
| { | |
| "cell_type": "code", | |
| "collapsed": false, | |
| "input": [ | |
| "#You will probably ned to install pyshp which contains the shapefile package\n", | |
| "#!pip install pyshp\n", | |
| "\n", | |
| "import shapefile\n", | |
| "\n", | |
| "#I got a few cribs for how to use this package to generate JOSN file from here\n", | |
| "#https://github.com/mlaloux/PyShp-as-Fiona--with-geo_interface-\n", | |
| "def records(filename): \n", | |
| " # generator \n", | |
| " reader = shapefile.Reader(filename) \n", | |
| " fields = reader.fields[1:] \n", | |
| " field_names = [field[0] for field in fields] \n", | |
| " for sr in reader.shapeRecords(): \n", | |
| " geom = sr.shape.__geo_interface__ \n", | |
| " atr = dict(zip(field_names, sr.record)) \n", | |
| " yield dict(geometry=geom,properties=atr)" | |
| ], | |
| "language": "python", | |
| "metadata": { | |
| "activity": false | |
| }, | |
| "outputs": [] | |
| }, | |
| { | |
| "cell_type": "code", | |
| "collapsed": false, | |
| "input": [ | |
| "#shapefiles for African countries can be found here:\n", | |
| "#http://www.mapmakerdata.co.uk/library/stacks/Africa/\n", | |
| "#eg I downloaded a file for Botswana via http://www.mapmakerdata.co.uk/library/stacks/Africa/Botswana/index.htm\n", | |
| "#from http://www.mapmakerdata.co.uk/library/stacks/Africa/Botswana/BOT_admin_SHP.zip\n", | |
| "#and then unzipped the file\n", | |
| "f='/Users/ajh59/Downloads/BOT_admin_SHP/BOT.shp'\n", | |
| "\n", | |
| "\n", | |
| "#Use the records() function to parse the shapefile\n", | |
| "c= records(f)\n", | |
| "#Here's what a single record looks like\n", | |
| "c.next()" | |
| ], | |
| "language": "python", | |
| "metadata": { | |
| "activity": false | |
| }, | |
| "outputs": [] | |
| }, | |
| { | |
| "cell_type": "code", | |
| "collapsed": false, | |
| "input": [ | |
| "import json\n", | |
| "\n", | |
| "#The following routine will generate a json file equivalent of the shapefile\n", | |
| "\n", | |
| "def geojsonify(shpfile,fn='gtest.json'):\n", | |
| " geojson = open(fn, \"w\")\n", | |
| " features=[row for row in records(shpfile)]\n", | |
| " for row in features:\n", | |
| " row[\"type\"]=\"Feature\"\n", | |
| " geojson.write(json.dumps(dict(type='FeatureCollection',features=features)))\n", | |
| " geojson.close()" | |
| ], | |
| "language": "python", | |
| "metadata": { | |
| "activity": false | |
| }, | |
| "outputs": [] | |
| }, | |
| { | |
| "cell_type": "code", | |
| "collapsed": false, | |
| "input": [ | |
| "!ls" | |
| ], | |
| "language": "python", | |
| "metadata": {}, | |
| "outputs": [] | |
| }, | |
| { | |
| "cell_type": "code", | |
| "collapsed": false, | |
| "input": [ | |
| "geojsonify(f,'gtestX.json')\n", | |
| "map_shp = folium.Map(location=[-25, 15], zoom_start=5)\n", | |
| "map_shp.geo_json(geo_path='gtestX.json')\n", | |
| "inline_map(map_shp)" | |
| ], | |
| "language": "python", | |
| "metadata": { | |
| "activity": false | |
| }, | |
| "outputs": [] | |
| }, | |
| { | |
| "cell_type": "markdown", | |
| "metadata": {}, | |
| "source": [ | |
| "## A Couple of Other Handy Tools\n", | |
| "\n", | |
| "*Lint* tools are tools that check whether or not something is correctly formatted. If geojson is not correctly formatted it won't rended on a map. [geojsonlint](http://geojsonlint.com/) is one tool for checking that your geojson is well formed.\n", | |
| "\n", | |
| "If you want to create your own, jhand drawn, shapefile, there are a couple of tools that can help you do it... For example, [geojson.io](http://geojson.io/) or a new one from Google, [Simple GeoJSON Editor](https://google-developers.appspot.com/maps/documentation/utils/geojson/)." | |
| ] | |
| } | |
| ], | |
| "metadata": {} | |
| } | |
| ] | |
| } |
This file contains bidirectional Unicode text that may be interpreted or compiled differently than what appears below. To review, open the file in an editor that reveals hidden Unicode characters.
Learn more about bidirectional Unicode characters
| #Test if your file exists at the path you're trying... | |
| def isItThere(myfile): | |
| with open(myfile) as myfile: | |
| head = [next(myfile) for x in xrange(2)] | |
| return head | |
| #eg | |
| myfile='whatever.csv' | |
| isItThere(myfile) | |
| #or | |
| myfile='wherever/whatever.csv' | |
| isItThere(myfile) |
This file contains bidirectional Unicode text that may be interpreted or compiled differently than what appears below. To review, open the file in an editor that reveals hidden Unicode characters.
Learn more about bidirectional Unicode characters
| ##Via http://stackoverflow.com/a/16696317/454773 | |
| #TH - added path and directory creator | |
| #The following function seems to be a pretty robust, generic function, | |
| #for downloading an arbitrary file to our local machine | |
| import requests | |
| import os | |
| def download_file(url,path=''): | |
| ''' Download a file from a particular URL to current directory/path with original filename ''' | |
| local_filename = url.split('/')[-1] | |
| local_filename='/'.join([path,local_filename]) | |
| #Create a new directory if it doesn't already exist | |
| if not os.path.exists(path): | |
| os.makedirs(path) | |
| # NOTE the stream=True parameter | |
| r = requests.get(url, stream=True) | |
| with open(local_filename, 'wb') as f: | |
| for chunk in r.iter_content(chunk_size=1024): | |
| if chunk: # filter out keep-alive new chunks | |
| f.write(chunk) | |
| f.flush() | |
| return local_filename | |
| #url='https://raw.githubusercontent.com/datasets/geo-boundaries-world-110m/master/countries.geojson' | |
| #download_file(url,path='newdemo') |
Sign up for free
to join this conversation on GitHub.
Already have an account?
Sign in to comment