Created
March 31, 2019 12:48
-
-
Save tubone24/0cda077c3bc9d4159379292aba31b2a3 to your computer and use it in GitHub Desktop.
AWS_tutorial_ETL_Chapter-1.ipynb
This file contains bidirectional Unicode text that may be interpreted or compiled differently than what appears below. To review, open the file in an editor that reveals hidden Unicode characters.
Learn more about bidirectional Unicode characters
| { | |
| "cells": [ | |
| { | |
| "metadata": {}, | |
| "cell_type": "markdown", | |
| "source": "# AWSを使ってセンサーデータの可視化をしてみよう!\n\n## IoTデバイスの普及\n\n近年、IoTの成長は凄まじいです。\n\n下のグラフは平成30年の情報通信白書に掲載されているIoTデバイスの推移となります。\n\n統計によると、2020年には403億個のデバイスが世界とつながるのです!\n\n[出典: 総務省 平成30年情報通信白書](http://www.soumu.go.jp/johotsusintokei/whitepaper/ja/h30/html/nd111200.html)\n\n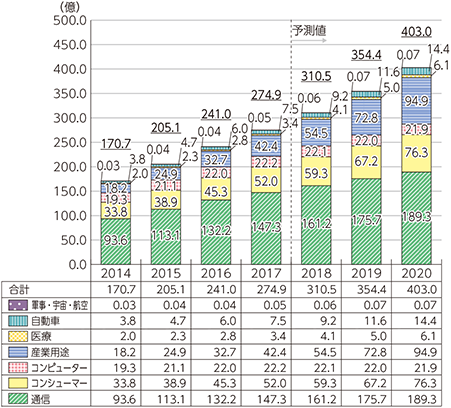\n\n## 大量のデバイスのデータはいかがする?\n\n400億以上のデバイスからくる大量のデータ。\n\n一つ一つのデータ量は小さくても量が多くなればそれなりに工夫しないと分析は難しいでしょう。\n\n大量のデータを収集し、必要なデータを抽出して分析しやすいような形に加工してし、データを貯めて、必要に応じて取り出し、可視化や機械学習のような高度な分析や予測をする必要があります。\n\n本教材では、AWSのマネージド・サービスを使って簡単なETL処理基盤を作り、データの可視化をするというものです。\n\n### 大量データの収集\n\nIoTコースで学びます。\n\n### 必要なデータを抽出し、分析しやすいように加工\n\nIoTデバイスからくるデータをそのまま使うことはあまりおすすめしません。なぜでしょう。\n\nIoTデバイスからくるデータはすべて同じ構造でくるとは限りません。欠損もあるかもしれません。社内の別のデータベースと対応させないと意味のないデータかもしれません。様々なデバイスから非同期でくるデータを1つにくっつけて、社内にある巨大なDBやオブジェクトストレージにインサートしてあげる必要もありそうです。\n\nそこで、 `ETL` ということをする必要があります。\n\nETLとは、 *Extract/Transform/Load* の略で、データの抽出、データの変換加工、データウェアハウスへのロードという意味です。\n\n本講習では、 AWS Glueというサービスを使います。\n\n### データを貯める/データを取り出す\n\nデータ量が多くなるとハードディスクを圧迫し、しんどいのでできればサマった形で加工しておきたいものです。\n\nしかしながらせっかく保存したデータも、月平均などでサマってしまうといざ特定の日のデータが使いたくなっても二度と使えなくなってしまいます。\n\n近年は、ハードディスク単価が安くなったことで、 `データウェアハウス` という考えが主流となりました。\n\nすなわち、時系列データをサマらずそのままの状態で保存することで、将来の意思決定に活用する、というものです。\n\nまた、データウェアハウスに保存したデータをSQLのように検索できると取り出しが楽です。\n\n多くのデータウェアハウスはデータの検索やマイニングが容易な環境が用意されています。\n\n本講習ではAWS S3、Athenaというサービスを利用します。\n\n### データを可視化する\n\nせっかくデータウェアハウスに入れたデータを使わない手はありません。\n\nさっそく可視化してみましょう。\n\n本講習では、Pythonの可視化ツール Dash を使ってインタラクティブでインテリジェンスな可視化をしてできるビジネスパーソンを演じてみます。\n\nまた、 Elasticsearch ServiceというAWSマネージドサービスを使ってKibanaという可視化ツールを使うこともエキストラ講習で行います。\n" | |
| }, | |
| { | |
| "metadata": {}, | |
| "cell_type": "markdown", | |
| "source": "## 構成図\n\n下に書いたものをAWS上で作ります。\n\n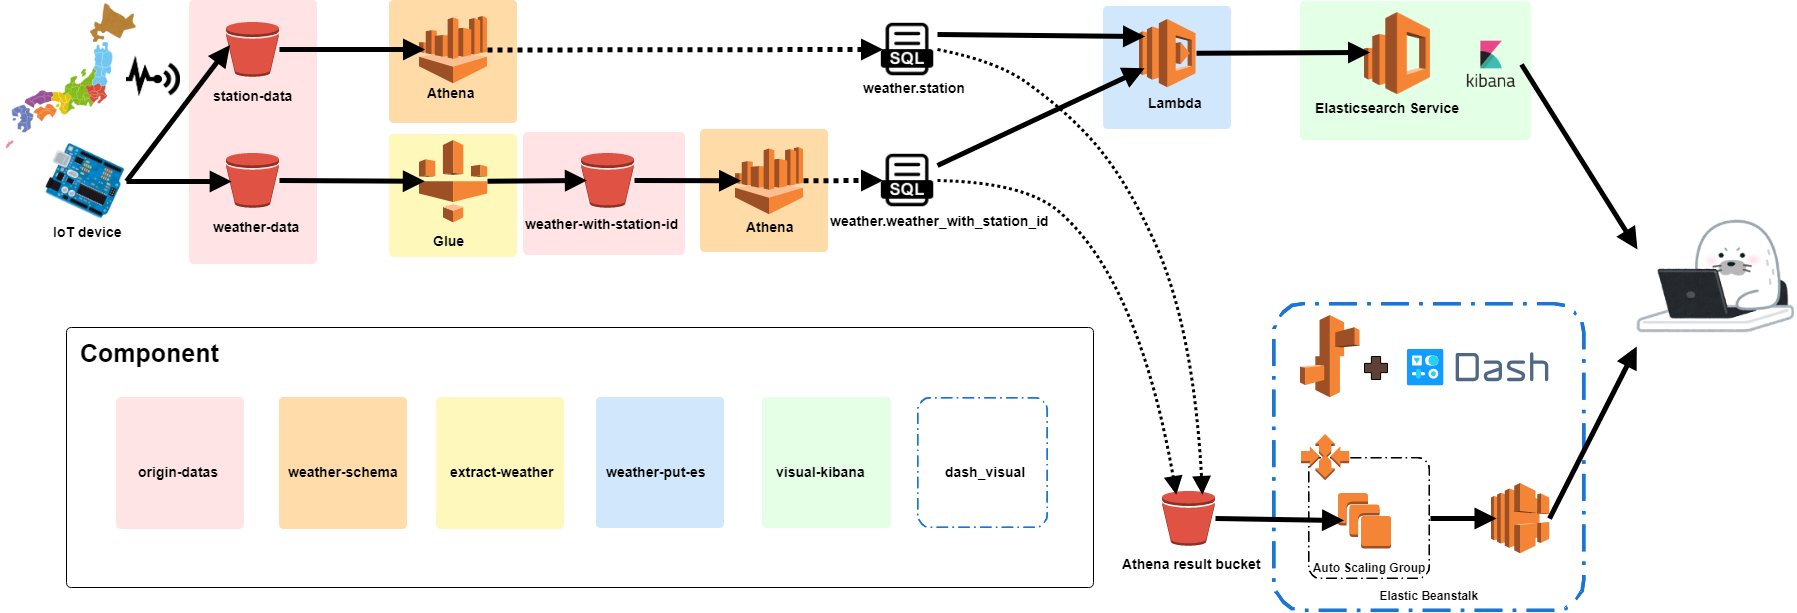\n\n## アウトプットイメージ\n\n下記のような可視化画面ができあがれば完成です。\n\nボタンやマウスオーバで各地の詳細天気が出てきたりします。\n\n" | |
| }, | |
| { | |
| "metadata": {}, | |
| "cell_type": "markdown", | |
| "source": "## データセットのダウンロード\n\n今回利用するデータセットをダウンロードします。\n\n[Kaggle](http://www.soumu.go.jp/johotsusintokei/whitepaper/ja/h30/html/nd111200.html)というData Scientistな人たちが、分析結果を 競争するデータ分析プラットホームがあります。今回はそこからデータセットを拝借します。\n\n予めKaggleのAPIが使えるようにユーザ登録を済ませましょう。\n\nhttps://www.kaggle.com/account/login\n\nユーザ登録を済ませたら、下記サイト手順でAPIを使うためのクレデンシャルを準備します。\n\nこちらの記事が参考になります。\n\n[kaggle-api kaggleコマンドの使い方](https://qiita.com/uni-3/items/f1fdbeeddd08ca22c80f)\n\n準備はできましたか?\n\n今回ダウンロードするデータセットは[Weather Data for Recruit Restaurant Competition](https://www.kaggle.com/huntermcgushion/rrv-weather-data)です。\n\n日本の1663個のデータステーションから取得できた気象データを扱います。\n\nそれではデータセットをダウンロードしましょう。\n下記のコマンドを打ちます。\n\n```\nmake download-dataset\n```\n\nそのまま、データ収集用のS3にデータをアップロードします。\n\n先にデータを入れるS3バケットを作成します。\n\n下記コマンドはTerraformというインフラコードツールです。\n\nTerraformの解説はここではしませんが、かなり便利ですのでおすすめです。\n\n```\nmake remote-enable ENV=aws-training COMPONENT=origin-datas\nmake create-env ENV=aws-training COMPONENT=origin-datas\nmake plan ENV=aws-training COMPONENT=origin-datas\n> xx add xx changes xx destroy とか出てくる\nmake apply ENV=aws-training COMPONENT=origin-datas\n```\n\nS3バケットができたらデータを投入します。\n\n```\nmake upload-weather-data\n```\n\nデータをアップロードしたら、少し中身を見てみましょう。\n\nお手元のエクセル、メモ帳(Atomなど)、またはJupyterで見ます。" | |
| }, | |
| { | |
| "metadata": { | |
| "ExecuteTime": { | |
| "end_time": "2019-03-31T12:28:31.648083Z", | |
| "start_time": "2019-03-31T12:28:31.594926Z" | |
| }, | |
| "trusted": true | |
| }, | |
| "cell_type": "code", | |
| "source": "import pandas as pd\n\ndf = pd.read_csv(\"../scripts/tmp_dir/1-1-16_5-31-17_Weather/akita__NONE__uno-tay.csv\")\ndf.head()", | |
| "execution_count": 5, | |
| "outputs": [ | |
| { | |
| "data": { | |
| "text/html": "<div>\n<style>\n .dataframe thead tr:only-child th {\n text-align: right;\n }\n\n .dataframe thead th {\n text-align: left;\n }\n\n .dataframe tbody tr th {\n vertical-align: top;\n }\n</style>\n<table border=\"1\" class=\"dataframe\">\n <thead>\n <tr style=\"text-align: right;\">\n <th></th>\n <th>calendar_date</th>\n <th>avg_temperature</th>\n <th>high_temperature</th>\n <th>low_temperature</th>\n <th>precipitation</th>\n <th>hours_sunlight</th>\n <th>solar_radiation</th>\n <th>deepest_snowfall</th>\n <th>total_snowfall</th>\n <th>avg_wind_speed</th>\n <th>avg_vapor_pressure</th>\n <th>avg_local_pressure</th>\n <th>avg_humidity</th>\n <th>avg_sea_pressure</th>\n <th>cloud_cover</th>\n </tr>\n </thead>\n <tbody>\n <tr>\n <th>0</th>\n <td>2016-01-01</td>\n <td>-2.0</td>\n <td>0.2</td>\n <td>-4.5</td>\n <td>2.5</td>\n <td>0.0</td>\n <td>NaN</td>\n <td>41</td>\n <td>6</td>\n <td>0.5</td>\n <td>NaN</td>\n <td>NaN</td>\n <td>NaN</td>\n <td>NaN</td>\n <td>NaN</td>\n </tr>\n <tr>\n <th>1</th>\n <td>2016-01-02</td>\n <td>1.2</td>\n <td>5.2</td>\n <td>-2.1</td>\n <td>10.0</td>\n <td>0.0</td>\n <td>NaN</td>\n <td>36</td>\n <td>0</td>\n <td>0.9</td>\n <td>NaN</td>\n <td>NaN</td>\n <td>NaN</td>\n <td>NaN</td>\n <td>NaN</td>\n </tr>\n <tr>\n <th>2</th>\n <td>2016-01-03</td>\n <td>1.2</td>\n <td>3.8</td>\n <td>0.3</td>\n <td>6.0</td>\n <td>0.0</td>\n <td>NaN</td>\n <td>18</td>\n <td>0</td>\n <td>0.2</td>\n <td>NaN</td>\n <td>NaN</td>\n <td>NaN</td>\n <td>NaN</td>\n <td>NaN</td>\n </tr>\n <tr>\n <th>3</th>\n <td>2016-01-04</td>\n <td>1.3</td>\n <td>6.9</td>\n <td>-0.2</td>\n <td>9.5</td>\n <td>0.0</td>\n <td>NaN</td>\n <td>13</td>\n <td>0</td>\n <td>0.8</td>\n <td>NaN</td>\n <td>NaN</td>\n <td>NaN</td>\n <td>NaN</td>\n <td>NaN</td>\n </tr>\n <tr>\n <th>4</th>\n <td>2016-01-05</td>\n <td>-1.3</td>\n <td>-0.1</td>\n <td>-2.3</td>\n <td>7.0</td>\n <td>0.0</td>\n <td>NaN</td>\n <td>33</td>\n <td>23</td>\n <td>0.7</td>\n <td>NaN</td>\n <td>NaN</td>\n <td>NaN</td>\n <td>NaN</td>\n <td>NaN</td>\n </tr>\n </tbody>\n</table>\n</div>", | |
| "text/plain": " calendar_date avg_temperature high_temperature low_temperature \\\n0 2016-01-01 -2.0 0.2 -4.5 \n1 2016-01-02 1.2 5.2 -2.1 \n2 2016-01-03 1.2 3.8 0.3 \n3 2016-01-04 1.3 6.9 -0.2 \n4 2016-01-05 -1.3 -0.1 -2.3 \n\n precipitation hours_sunlight solar_radiation deepest_snowfall \\\n0 2.5 0.0 NaN 41 \n1 10.0 0.0 NaN 36 \n2 6.0 0.0 NaN 18 \n3 9.5 0.0 NaN 13 \n4 7.0 0.0 NaN 33 \n\n total_snowfall avg_wind_speed avg_vapor_pressure avg_local_pressure \\\n0 6 0.5 NaN NaN \n1 0 0.9 NaN NaN \n2 0 0.2 NaN NaN \n3 0 0.8 NaN NaN \n4 23 0.7 NaN NaN \n\n avg_humidity avg_sea_pressure cloud_cover \n0 NaN NaN NaN \n1 NaN NaN NaN \n2 NaN NaN NaN \n3 NaN NaN NaN \n4 NaN NaN NaN " | |
| }, | |
| "execution_count": 5, | |
| "metadata": {}, | |
| "output_type": "execute_result" | |
| } | |
| ] | |
| }, | |
| { | |
| "metadata": {}, | |
| "cell_type": "markdown", | |
| "source": "weatherデータは日次でデータが入っているようです。\n\n平均気温の他、最高気温、最低気温、降水量、日照量などが入ってます。\n\n詳しい解説は[Weather Data for Recruit Restaurant Competition](https://www.kaggle.com/huntermcgushion/rrv-weather-data))を見ましょう。\n\nNaNというデータが入っていない項目もある程度あるようです。\n\nstationの場所に関する情報は入っていませんでした。station_idも項目がありませんが、ファイル名がstation_idとなっているようです。\n\nもう少し見てみましょう。" | |
| }, | |
| { | |
| "metadata": { | |
| "ExecuteTime": { | |
| "end_time": "2019-03-31T12:34:25.027277Z", | |
| "start_time": "2019-03-31T12:34:24.865774Z" | |
| }, | |
| "trusted": true | |
| }, | |
| "cell_type": "code", | |
| "source": "df.describe()", | |
| "execution_count": 6, | |
| "outputs": [ | |
| { | |
| "data": { | |
| "text/html": "<div>\n<style>\n .dataframe thead tr:only-child th {\n text-align: right;\n }\n\n .dataframe thead th {\n text-align: left;\n }\n\n .dataframe tbody tr th {\n vertical-align: top;\n }\n</style>\n<table border=\"1\" class=\"dataframe\">\n <thead>\n <tr style=\"text-align: right;\">\n <th></th>\n <th>avg_temperature</th>\n <th>high_temperature</th>\n <th>low_temperature</th>\n <th>precipitation</th>\n <th>hours_sunlight</th>\n <th>solar_radiation</th>\n <th>deepest_snowfall</th>\n <th>total_snowfall</th>\n <th>avg_wind_speed</th>\n <th>avg_vapor_pressure</th>\n <th>avg_local_pressure</th>\n <th>avg_humidity</th>\n <th>avg_sea_pressure</th>\n <th>cloud_cover</th>\n </tr>\n </thead>\n <tbody>\n <tr>\n <th>count</th>\n <td>517.000000</td>\n <td>517.000000</td>\n <td>517.000000</td>\n <td>517.000000</td>\n <td>517.000000</td>\n <td>0.0</td>\n <td>517.000000</td>\n <td>517.000000</td>\n <td>504.000000</td>\n <td>0.0</td>\n <td>0.0</td>\n <td>0.0</td>\n <td>0.0</td>\n <td>0.0</td>\n </tr>\n <tr>\n <th>mean</th>\n <td>7.954932</td>\n <td>12.182205</td>\n <td>4.118569</td>\n <td>5.273694</td>\n <td>3.225919</td>\n <td>NaN</td>\n <td>30.646035</td>\n <td>2.630561</td>\n <td>1.291667</td>\n <td>NaN</td>\n <td>NaN</td>\n <td>NaN</td>\n <td>NaN</td>\n <td>NaN</td>\n </tr>\n <tr>\n <th>std</th>\n <td>8.948734</td>\n <td>10.065541</td>\n <td>8.367684</td>\n <td>10.155002</td>\n <td>3.644150</td>\n <td>NaN</td>\n <td>44.246452</td>\n <td>6.213332</td>\n <td>0.694833</td>\n <td>NaN</td>\n <td>NaN</td>\n <td>NaN</td>\n <td>NaN</td>\n <td>NaN</td>\n </tr>\n <tr>\n <th>min</th>\n <td>-7.400000</td>\n <td>-5.500000</td>\n <td>-11.400000</td>\n <td>0.000000</td>\n <td>0.000000</td>\n <td>NaN</td>\n <td>0.000000</td>\n <td>0.000000</td>\n <td>0.000000</td>\n <td>NaN</td>\n <td>NaN</td>\n <td>NaN</td>\n <td>NaN</td>\n <td>NaN</td>\n </tr>\n <tr>\n <th>25%</th>\n <td>-0.100000</td>\n <td>2.600000</td>\n <td>-2.900000</td>\n <td>0.000000</td>\n <td>0.100000</td>\n <td>NaN</td>\n <td>0.000000</td>\n <td>0.000000</td>\n <td>0.800000</td>\n <td>NaN</td>\n <td>NaN</td>\n <td>NaN</td>\n <td>NaN</td>\n <td>NaN</td>\n </tr>\n <tr>\n <th>50%</th>\n <td>6.300000</td>\n <td>11.200000</td>\n <td>1.900000</td>\n <td>1.500000</td>\n <td>1.700000</td>\n <td>NaN</td>\n <td>0.000000</td>\n <td>0.000000</td>\n <td>1.150000</td>\n <td>NaN</td>\n <td>NaN</td>\n <td>NaN</td>\n <td>NaN</td>\n <td>NaN</td>\n </tr>\n <tr>\n <th>75%</th>\n <td>16.300000</td>\n <td>21.400000</td>\n <td>11.200000</td>\n <td>6.000000</td>\n <td>5.900000</td>\n <td>NaN</td>\n <td>66.000000</td>\n <td>2.000000</td>\n <td>1.700000</td>\n <td>NaN</td>\n <td>NaN</td>\n <td>NaN</td>\n <td>NaN</td>\n <td>NaN</td>\n </tr>\n <tr>\n <th>max</th>\n <td>26.300000</td>\n <td>32.100000</td>\n <td>21.300000</td>\n <td>115.000000</td>\n <td>12.000000</td>\n <td>NaN</td>\n <td>139.000000</td>\n <td>57.000000</td>\n <td>4.000000</td>\n <td>NaN</td>\n <td>NaN</td>\n <td>NaN</td>\n <td>NaN</td>\n <td>NaN</td>\n </tr>\n </tbody>\n</table>\n</div>", | |
| "text/plain": " avg_temperature high_temperature low_temperature precipitation \\\ncount 517.000000 517.000000 517.000000 517.000000 \nmean 7.954932 12.182205 4.118569 5.273694 \nstd 8.948734 10.065541 8.367684 10.155002 \nmin -7.400000 -5.500000 -11.400000 0.000000 \n25% -0.100000 2.600000 -2.900000 0.000000 \n50% 6.300000 11.200000 1.900000 1.500000 \n75% 16.300000 21.400000 11.200000 6.000000 \nmax 26.300000 32.100000 21.300000 115.000000 \n\n hours_sunlight solar_radiation deepest_snowfall total_snowfall \\\ncount 517.000000 0.0 517.000000 517.000000 \nmean 3.225919 NaN 30.646035 2.630561 \nstd 3.644150 NaN 44.246452 6.213332 \nmin 0.000000 NaN 0.000000 0.000000 \n25% 0.100000 NaN 0.000000 0.000000 \n50% 1.700000 NaN 0.000000 0.000000 \n75% 5.900000 NaN 66.000000 2.000000 \nmax 12.000000 NaN 139.000000 57.000000 \n\n avg_wind_speed avg_vapor_pressure avg_local_pressure avg_humidity \\\ncount 504.000000 0.0 0.0 0.0 \nmean 1.291667 NaN NaN NaN \nstd 0.694833 NaN NaN NaN \nmin 0.000000 NaN NaN NaN \n25% 0.800000 NaN NaN NaN \n50% 1.150000 NaN NaN NaN \n75% 1.700000 NaN NaN NaN \nmax 4.000000 NaN NaN NaN \n\n avg_sea_pressure cloud_cover \ncount 0.0 0.0 \nmean NaN NaN \nstd NaN NaN \nmin NaN NaN \n25% NaN NaN \n50% NaN NaN \n75% NaN NaN \nmax NaN NaN " | |
| }, | |
| "execution_count": 6, | |
| "metadata": {}, | |
| "output_type": "execute_result" | |
| } | |
| ] | |
| }, | |
| { | |
| "metadata": {}, | |
| "cell_type": "markdown", | |
| "source": "このステーションではデータ数が517あったみたいです。\n\n平均気温の平均は 7.95度だったようです。\n\nこの後AWSで分析しますので、いったんここまででやめときましょうか・\n\nstationのデータも見てみましょう。" | |
| }, | |
| { | |
| "metadata": { | |
| "ExecuteTime": { | |
| "end_time": "2019-03-31T12:37:22.313544Z", | |
| "start_time": "2019-03-31T12:37:22.244883Z" | |
| }, | |
| "trusted": true | |
| }, | |
| "cell_type": "code", | |
| "source": "df2 = pd.read_csv(\"../scripts/tmp_dir/weather_stations.csv\")\ndf2.head()", | |
| "execution_count": 8, | |
| "outputs": [ | |
| { | |
| "data": { | |
| "text/html": "<div>\n<style>\n .dataframe thead tr:only-child th {\n text-align: right;\n }\n\n .dataframe thead th {\n text-align: left;\n }\n\n .dataframe tbody tr th {\n vertical-align: top;\n }\n</style>\n<table border=\"1\" class=\"dataframe\">\n <thead>\n <tr style=\"text-align: right;\">\n <th></th>\n <th>id</th>\n <th>prefecture</th>\n <th>first_name</th>\n <th>second_name</th>\n <th>latitude</th>\n <th>longitude</th>\n <th>altitude</th>\n <th>date_terminated</th>\n </tr>\n </thead>\n <tbody>\n <tr>\n <th>0</th>\n <td>aichi__ai-xi-kana__isaai</td>\n <td>aichi</td>\n <td>ai-xi-kana</td>\n <td>isaai</td>\n <td>35.216667</td>\n <td>136.698333</td>\n <td>5.0</td>\n <td>NaN</td>\n </tr>\n <tr>\n <th>1</th>\n <td>aichi__aki-kana__azo</td>\n <td>aichi</td>\n <td>aki-kana</td>\n <td>azo</td>\n <td>35.078333</td>\n <td>137.413333</td>\n <td>613.0</td>\n <td>NaN</td>\n </tr>\n <tr>\n <th>2</th>\n <td>aichi__centrair-kana__centrair</td>\n <td>aichi</td>\n <td>centrair-kana</td>\n <td>centrair</td>\n <td>34.858333</td>\n <td>136.805000</td>\n <td>4.0</td>\n <td>NaN</td>\n </tr>\n <tr>\n <th>3</th>\n <td>aichi__chapel-mountain-kana__chaw-yama</td>\n <td>aichi</td>\n <td>chapel-mountain-kana</td>\n <td>chaw-yama</td>\n <td>35.220000</td>\n <td>137.660000</td>\n <td>1216.0</td>\n <td>NaN</td>\n </tr>\n <tr>\n <th>4</th>\n <td>aichi__gamagori-kana__gamagori</td>\n <td>aichi</td>\n <td>gamagori-kana</td>\n <td>gamagori</td>\n <td>34.845000</td>\n <td>137.216667</td>\n <td>55.0</td>\n <td>NaN</td>\n </tr>\n </tbody>\n</table>\n</div>", | |
| "text/plain": " id prefecture first_name \\\n0 aichi__ai-xi-kana__isaai aichi ai-xi-kana \n1 aichi__aki-kana__azo aichi aki-kana \n2 aichi__centrair-kana__centrair aichi centrair-kana \n3 aichi__chapel-mountain-kana__chaw-yama aichi chapel-mountain-kana \n4 aichi__gamagori-kana__gamagori aichi gamagori-kana \n\n second_name latitude longitude altitude date_terminated \n0 isaai 35.216667 136.698333 5.0 NaN \n1 azo 35.078333 137.413333 613.0 NaN \n2 centrair 34.858333 136.805000 4.0 NaN \n3 chaw-yama 35.220000 137.660000 1216.0 NaN \n4 gamagori 34.845000 137.216667 55.0 NaN " | |
| }, | |
| "execution_count": 8, | |
| "metadata": {}, | |
| "output_type": "execute_result" | |
| } | |
| ] | |
| }, | |
| { | |
| "metadata": { | |
| "ExecuteTime": { | |
| "end_time": "2019-03-31T12:40:15.686750Z", | |
| "start_time": "2019-03-31T12:40:15.681175Z" | |
| } | |
| }, | |
| "cell_type": "markdown", | |
| "source": "こちらには、ステーションの情報があります。\n\nidはステーションのIDですし、latitude、longitudeは緯度経度情報です。これは使えそう。\n\n## ではさっそく分析してみましょう!\n\nさあAWSを使ってワクワクな可視化をして行きましょう!" | |
| } | |
| ], | |
| "metadata": { | |
| "gist": { | |
| "id": "", | |
| "data": { | |
| "description": "AWS_tutorial_ETL_Chapter-1.ipynb", | |
| "public": true | |
| } | |
| }, | |
| "kernelspec": { | |
| "name": "python3", | |
| "display_name": "Python 3", | |
| "language": "python" | |
| }, | |
| "language_info": { | |
| "name": "python", | |
| "version": "3.6.1", | |
| "mimetype": "text/x-python", | |
| "codemirror_mode": { | |
| "name": "ipython", | |
| "version": 3 | |
| }, | |
| "pygments_lexer": "ipython3", | |
| "nbconvert_exporter": "python", | |
| "file_extension": ".py" | |
| }, | |
| "latex_envs": { | |
| "eqNumInitial": 1, | |
| "eqLabelWithNumbers": true, | |
| "current_citInitial": 1, | |
| "cite_by": "apalike", | |
| "bibliofile": "biblio.bib", | |
| "LaTeX_envs_menu_present": true, | |
| "labels_anchors": false, | |
| "latex_user_defs": false, | |
| "user_envs_cfg": false, | |
| "report_style_numbering": false, | |
| "autoclose": false, | |
| "autocomplete": true, | |
| "hotkeys": { | |
| "equation": "Ctrl-E", | |
| "itemize": "Ctrl-I" | |
| } | |
| }, | |
| "toc": { | |
| "nav_menu": {}, | |
| "number_sections": true, | |
| "sideBar": true, | |
| "skip_h1_title": false, | |
| "base_numbering": 1, | |
| "title_cell": "Table of Contents", | |
| "title_sidebar": "Contents", | |
| "toc_cell": false, | |
| "toc_position": {}, | |
| "toc_section_display": true, | |
| "toc_window_display": true | |
| } | |
| }, | |
| "nbformat": 4, | |
| "nbformat_minor": 2 | |
| } |
Sign up for free
to join this conversation on GitHub.
Already have an account?
Sign in to comment