Created
January 30, 2019 22:18
-
-
Save zonca/b3045651cbc90fe699d2e56df490b005 to your computer and use it in GitHub Desktop.
This file contains bidirectional Unicode text that may be interpreted or compiled differently than what appears below. To review, open the file in an editor that reveals hidden Unicode characters.
Learn more about bidirectional Unicode characters
| { | |
| "cells": [ | |
| { | |
| "cell_type": "code", | |
| "execution_count": 1, | |
| "metadata": {}, | |
| "outputs": [], | |
| "source": [ | |
| "import healpy as hp\n", | |
| "import numpy as np" | |
| ] | |
| }, | |
| { | |
| "cell_type": "code", | |
| "execution_count": 2, | |
| "metadata": {}, | |
| "outputs": [], | |
| "source": [ | |
| "import plotly.plotly as py\n", | |
| "import plotly.graph_objs as go\n", | |
| "\n", | |
| "import numpy as np\n" | |
| ] | |
| }, | |
| { | |
| "cell_type": "code", | |
| "execution_count": 3, | |
| "metadata": {}, | |
| "outputs": [], | |
| "source": [ | |
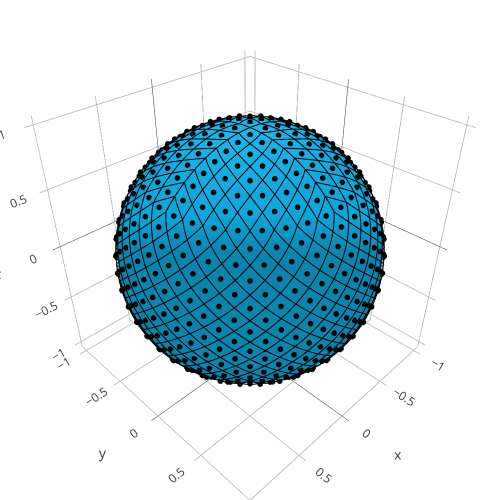
| "nside = 8\n", | |
| "npix = hp.nside2npix(nside)\n", | |
| "pix_centers = hp.pix2vec(nside, np.arange(npix))" | |
| ] | |
| }, | |
| { | |
| "cell_type": "code", | |
| "execution_count": 4, | |
| "metadata": {}, | |
| "outputs": [], | |
| "source": [ | |
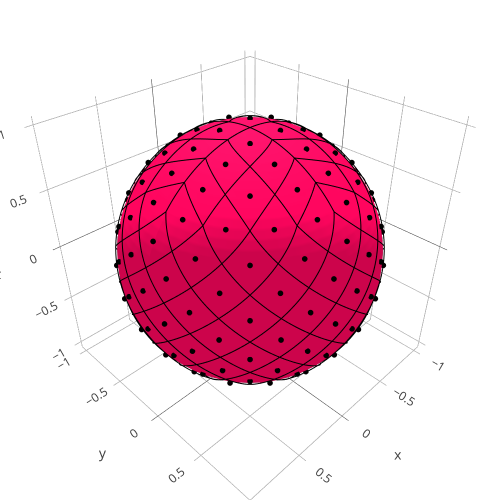
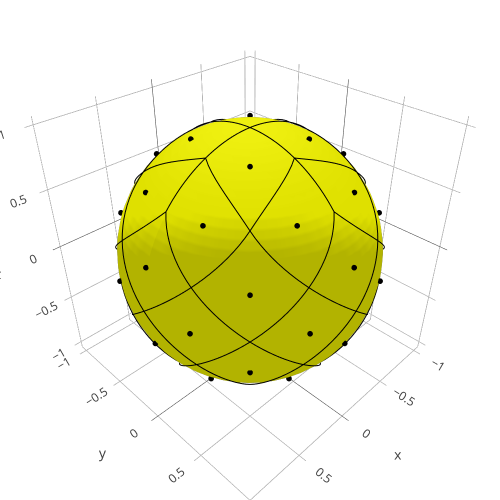
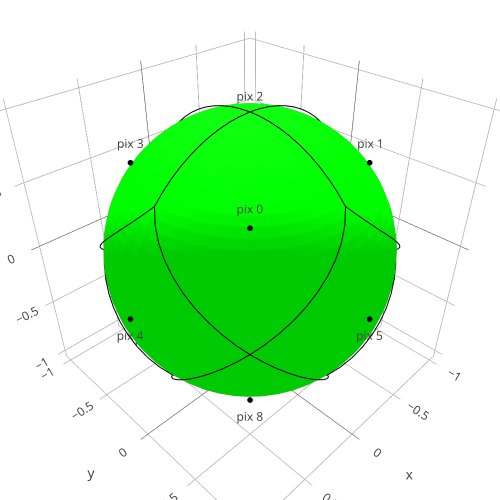
| "color = { 1: 'rgb(0,252,1)',\n", | |
| " 2: 'rgb(223,224,0)',\n", | |
| " 4: 'rgb(255,5,94)',\n", | |
| " 8: 'rgb(12,166,218)'\n", | |
| " }" | |
| ] | |
| }, | |
| { | |
| "cell_type": "code", | |
| "execution_count": 5, | |
| "metadata": {}, | |
| "outputs": [], | |
| "source": [ | |
| "#just a sphere\n", | |
| "num_samples = 50\n", | |
| "u = np.linspace(0, 2 * np.pi, num_samples)\n", | |
| "v = np.linspace(0, np.pi, num_samples)\n", | |
| "r = .99\n", | |
| "x = r * np.outer(np.cos(u), np.sin(v))\n", | |
| "y = r * np.outer(np.sin(u), np.sin(v))\n", | |
| "z = r * np.outer(np.ones(np.size(u)), np.cos(v))\n", | |
| "\n", | |
| "sphere = go.Surface(\n", | |
| " x=x,\n", | |
| " y=y,\n", | |
| " z=z,\n", | |
| " opacity=1,\n", | |
| " showscale=False,\n", | |
| " name=\"sphere\",\n", | |
| " surfacecolor=np.zeros(num_samples),\n", | |
| " cmin=0,\n", | |
| " cmax=1,\n", | |
| "colorscale = [[0, color[nside]],\n", | |
| " [1, 'black'],\n", | |
| "\n", | |
| " ]\n", | |
| " )" | |
| ] | |
| }, | |
| { | |
| "cell_type": "code", | |
| "execution_count": 6, | |
| "metadata": {}, | |
| "outputs": [], | |
| "source": [ | |
| "boundaries_plots = []\n", | |
| "for pix in range(npix):\n", | |
| " boundaries = hp.boundaries(nside, pix, step=10)\n", | |
| "\n", | |
| " boundaries_plots.append(go.Scatter3d(\n", | |
| " name=\"pixel_{}_boundary\".format(pix),\n", | |
| " x=boundaries[0],\n", | |
| " y=boundaries[1],\n", | |
| " z=boundaries[2],\n", | |
| " mode=\"lines\",\n", | |
| " line=dict(\n", | |
| " color='black',\n", | |
| " width=2\n", | |
| " ),\n", | |
| " ) )" | |
| ] | |
| }, | |
| { | |
| "cell_type": "code", | |
| "execution_count": 7, | |
| "metadata": {}, | |
| "outputs": [], | |
| "source": [ | |
| "textposition = []\n", | |
| "for pix_z in pix_centers[2]:\n", | |
| " pos = \"top center\" if pix_z > 0 else \"bottom center\"\n", | |
| " textposition.append(pos)" | |
| ] | |
| }, | |
| { | |
| "cell_type": "code", | |
| "execution_count": 8, | |
| "metadata": {}, | |
| "outputs": [ | |
| { | |
| "data": { | |
| "text/html": [ | |
| "<iframe id=\"igraph\" scrolling=\"no\" style=\"border:none;\" seamless=\"seamless\" src=\"https://plot.ly/~AndreaZonca/31.embed\" height=\"500px\" width=\"500px\"></iframe>" | |
| ], | |
| "text/plain": [ | |
| "<plotly.tools.PlotlyDisplay object>" | |
| ] | |
| }, | |
| "execution_count": 8, | |
| "metadata": {}, | |
| "output_type": "execute_result" | |
| } | |
| ], | |
| "source": [ | |
| "\n", | |
| "pixel_centers_scatter = go.Scatter3d(\n", | |
| " x=pix_centers[0],\n", | |
| " y=pix_centers[1],\n", | |
| " z=pix_centers[2],\n", | |
| " marker=dict(\n", | |
| " color=\"black\",\n", | |
| " size=3,\n", | |
| " line=dict(\n", | |
| " color='black',\n", | |
| " width=0.5\n", | |
| " ),\n", | |
| " opacity=1\n", | |
| " ),\n", | |
| " name = \"pixel_centers\",\n", | |
| " #mode='markers+text',\n", | |
| " mode='markers',\n", | |
| " text=[\"{}\".format(pix) for pix in range(npix)],\n", | |
| " textposition = textposition\n", | |
| ")\n", | |
| "\n", | |
| "data = [pixel_centers_scatter, sphere] + boundaries_plots\n", | |
| "layout = go.Layout(\n", | |
| " showlegend=False,\n", | |
| " margin=dict(\n", | |
| " l=0,\n", | |
| " r=0,\n", | |
| " b=0,\n", | |
| " t=0\n", | |
| " ),\n", | |
| " width=500,\n", | |
| " height=500,\n", | |
| ")\n", | |
| "fig = go.Figure(data=data, layout=layout)\n", | |
| "py.iplot(fig, filename='simple-3d-scatter')" | |
| ] | |
| }, | |
| { | |
| "cell_type": "code", | |
| "execution_count": null, | |
| "metadata": {}, | |
| "outputs": [], | |
| "source": [] | |
| }, | |
| { | |
| "cell_type": "code", | |
| "execution_count": null, | |
| "metadata": {}, | |
| "outputs": [], | |
| "source": [] | |
| } | |
| ], | |
| "metadata": { | |
| "kernelspec": { | |
| "display_name": "PySM 2", | |
| "language": "python", | |
| "name": "pysm2" | |
| }, | |
| "language_info": { | |
| "codemirror_mode": { | |
| "name": "ipython", | |
| "version": 3 | |
| }, | |
| "file_extension": ".py", | |
| "mimetype": "text/x-python", | |
| "name": "python", | |
| "nbconvert_exporter": "python", | |
| "pygments_lexer": "ipython3", | |
| "version": "3.6.7" | |
| } | |
| }, | |
| "nbformat": 4, | |
| "nbformat_minor": 2 | |
| } |
Sign up for free
to join this conversation on GitHub.
Already have an account?
Sign in to comment
Outputs at nside 1, 2, 4, 8 in png