-
-
Save fransua/da703c3d2ba121903c0de5e976838b71 to your computer and use it in GitHub Desktop.
| from itertools import chain | |
| from matplotlib.collections import LineCollection | |
| from matplotlib import markers | |
| from matplotlib.path import Path | |
| import numpy as np | |
| from ete3 import Tree, NodeStyle | |
| def round_sig(x, sig=2): | |
| return round(x, sig - int(floor(np.log10(abs(x)))) - 1) | |
| def to_coord(x, y, xmin, xmax, ymin, ymax, plt_xmin, plt_ymin, plt_width, plt_height): | |
| x = (x - xmin) / (xmax - xmin) * plt_width + plt_xmin | |
| y = (y - ymin) / (ymax - ymin) * plt_height + plt_ymin | |
| return x, y | |
| def plot_tree(tree, align_names=False, name_offset=None, max_dist=None, font_size=9, axe=None, **kwargs): | |
| """ | |
| Plots a ete3.Tree object using matploltib. | |
| :param tree: ete Tree object | |
| :param False align_names: if True names will be aligned vertically | |
| :param None max_dist: if defined any branch longer than the given value will be | |
| reduced by this same value. | |
| :param None name_offset: offset relative to tips to write leaf_names. In bL scale | |
| :param 12 font_size: to write text | |
| :param None axe: a matploltib.Axe object on which the tree will be painted. | |
| :param kwargs: for tree edge drawing (matplotlib LineCollection) | |
| :param 1 ms: marker size for tree nodes (relative to number of nodes) | |
| :returns: a dictionary of node objects with their coordinates | |
| """ | |
| if axe is None: | |
| axe = plt.subplot(111) | |
| def __draw_edge_nm(c, x): | |
| h = node_pos[c] | |
| hlinec.append(((x, h), (x + c.dist, h))) | |
| hlines.append(cstyle) | |
| return (x + c.dist, h) | |
| def __draw_edge_md(c, x): | |
| h = node_pos[c] | |
| if c in cut_edge: | |
| offset = max_x / 600. | |
| hlinec.append(((x, h), (x + c.dist / 2 - offset, h))) | |
| hlines.append(cstyle) | |
| hlinec.append(((x + c.dist / 2 + offset, h), (x + c.dist, h))) | |
| hlines.append(cstyle) | |
| hlinec.append(((x + c.dist / 2, h - 0.05), (x + c.dist / 2 - 2 * offset, h + 0.05))) | |
| hlines.append(cstyle) | |
| hlinec.append(((x + c.dist / 2 + 2 * offset, h - 0.05), (x + c.dist / 2, h + 0.05))) | |
| hlines.append(cstyle) | |
| axe.text(x + c.dist / 2, h - 0.07, '+%g' % max_dist, va='top', | |
| ha='center', size=2. * font_size / 3) | |
| else: | |
| hlinec.append(((x, h), (x + c.dist, h))) | |
| hlines.append(cstyle) | |
| return (x + c.dist, h) | |
| __draw_edge = __draw_edge_nm if max_dist is None else __draw_edge_md | |
| vlinec = [] | |
| vlines = [] | |
| hlinec = [] | |
| hlines = [] | |
| nodes = [] | |
| nodex = [] | |
| nodey = [] | |
| ali_lines = [] | |
| # to align leaf names | |
| tree = tree.copy() | |
| max_x = max(n.get_distance(tree) for n in tree.iter_leaves()) | |
| coords = {} | |
| node_pos = dict((n2, i) for i, n2 in enumerate(tree.get_leaves()[::-1])) | |
| node_list = tree.iter_descendants(strategy='postorder') | |
| node_list = chain(node_list, [tree]) | |
| # reduce branch length | |
| cut_edge = set() | |
| if max_dist is not None: | |
| for n in tree.iter_descendants(): | |
| if n.dist > max_dist: | |
| n.dist -= max_dist | |
| cut_edge.add(n) | |
| if name_offset is None: | |
| name_offset = max_x / 100. | |
| # draw tree | |
| for n in node_list: | |
| style = n._get_style() | |
| x = __builtin__.sum(n2.dist for n2 in n.iter_ancestors()) + n.dist | |
| if n.is_leaf(): | |
| y = node_pos[n] | |
| if align_names: | |
| axe.text(max_x + name_offset, y, n.name, | |
| va='center', size=font_size) | |
| ali_lines.append(((x, y), (max_x + name_offset, y))) | |
| else: | |
| axe.text(x + name_offset, y, n.name, | |
| va='center', size=font_size) | |
| else: | |
| y = np.mean([node_pos[n2] for n2 in n.children]) | |
| node_pos[n] = y | |
| # draw vertical line | |
| vlinec.append(((x, node_pos[n.children[0]]), (x, node_pos[n.children[-1]]))) | |
| vlines.append(style) | |
| # draw horizontal lines | |
| for child in n.children: | |
| cstyle = child._get_style() | |
| coords[child] = __draw_edge(child, x) | |
| nodes.append(style) | |
| nodex.append(x) | |
| nodey.append(y) | |
| # draw root | |
| __draw_edge(tree, 0) | |
| lstyles = ['-', '--', ':'] | |
| hline_col = LineCollection(hlinec, colors=[l['hz_line_color'] for l in hlines], | |
| linestyle=[lstyles[l['hz_line_type']] for l in hlines], | |
| linewidth=[(l['hz_line_width'] + 1.) / 2 for l in hlines]) | |
| vline_col = LineCollection(vlinec, colors=[l['vt_line_color'] for l in vlines], | |
| linestyle=[lstyles[l['vt_line_type']] for l in vlines], | |
| linewidth=[(l['vt_line_width'] + 1.) / 2 for l in vlines]) | |
| ali_line_col = LineCollection(ali_lines, colors='k') | |
| axe.add_collection(hline_col) | |
| axe.add_collection(vline_col) | |
| axe.add_collection(ali_line_col) | |
| nshapes = dict((('circle', 'o'), ('square', 's'), ('sphere', 'o'))) | |
| shapes = set(n['shape'] for n in nodes) | |
| for shape in shapes: | |
| indexes = [i for i, n in enumerate(nodes) if n['shape'] == shape] | |
| scat = axe.scatter([nodex[i] for i in indexes], | |
| [nodey[i] for i in indexes], | |
| s=0, marker=nshapes.get(shape, shape)) | |
| scat.set_sizes([(nodes[i]['size'])**2 / 2 for i in indexes]) | |
| scat.set_color([nodes[i]['fgcolor'] for i in indexes]) | |
| scat.set_zorder(10) | |
| # scale line | |
| xmin, xmax = axe.get_xlim() | |
| ymin, ymax = axe.get_ylim() | |
| diffy = ymax - ymin | |
| dist = round_sig((xmax - xmin) / 5, sig=1) | |
| ymin -= diffy / 100. | |
| axe.plot([xmin, xmin + dist], [ymin, ymin], color='k') | |
| axe.plot([xmin, xmin], [ymin - diffy / 200., ymin + diffy / 200.], color='k') | |
| axe.plot([xmin + dist, xmin + dist], [ymin - diffy / 200., ymin + diffy / 200.], | |
| color='k') | |
| axe.text((xmin + xmin + dist) / 2, ymin - diffy / 200., dist, va='top', | |
| ha='center', size=font_size) | |
| axe.set_axis_off() | |
| return coords | |
Example showing how to insert some random plots:
tree = Tree()
tree.populate(10, random_branches=True)

fig = plt.figure(figsize=(12,12))

plt_xmin, plt_ymin, plt_width, plt_height = 0.1, 0.1, 0.55, 0.8

ax1 = fig.add_axes([plt_xmin, plt_ymin, plt_width, plt_height])

coords = plot_tree(tree, name_offset=0.7, axe=ax1)

xmin, xmax = ax1.get_xlim()
ymin, ymax = ax1.get_ylim()
xmax *= 1.2

for node in coords:
    x, y = coords[node]
    if node.name and node.name in tree:
        xcax = x + 0.1
        ycax = y - 0.4

        xax, yax = to_coord(xcax, ycax, xmin, xmax, ymin, ymax,
                            plt_xmin, plt_ymin, plt_width, plt_height)

        ax2 = fig.add_axes([xax, yax, 0.05, 0.05])
        ax2.set_xticks([])
        ax2.set_yticks([])

        x, y = np.random.random(20), np.random.random(20)
        ax2.plot(x, y, '.', ms=3, alpha=0.5, color='tab:blue')
        corr = np.corrcoef(x, y)[0][1]
        a, b = np.polyfit(x, y, 1)

        x_sim = np.linspace(0, 1, 100)
        ax2.plot(x_sim, x_sim*a + b, color='tab:red')

        ax2.text(0.05, 0.95, round(corr, 2), size=8, va='top', ha='left')
        ax2.set_xlim(0, 1)
        ax2.set_ylim(0, 1)

plt_xmin, plt_ymin, plt_width, plt_height = 0.7, 0.1, 0.2, 0.8

ax3 = fig.add_axes([plt_xmin, plt_ymin, plt_width, plt_height], sharey=ax1)
vp = plt.violinplot([np.random.random(45)**2 for i in range(len(tree))], showmeans=True,
                    positions=range(len(tree)),  vert=False)

for n, pc in enumerate(vp['bodies']):
    pc.set_facecolor(plt.cm.Reds(float(n) / len(tree)))
    pc.set_edgecolor('black')
    pc.set_alpha(1)
vp['cbars'].set_color('k')
vp['cmins'].set_color('k')
vp['cmaxes'].set_color('k')
vp['cmeans'].set_color('k')

# Hide the right and top spines
ax3.spines['right'].set_visible(False)
ax3.spines['left'].set_visible(False)
ax3.spines['top'].set_visible(False)

# Only show ticks on the left and bottom spines
ax3.xaxis.set_ticks_position('bottom')
ax3.set_yticks([])

_ = ax1.set_xlim(xmin, xmax)
_ = ax1.set_ylim(ymin, ymax)

It is a nice solution! But is it feasible realize interaction like ETE builtin implementation by matplotlib here?
Hi,
sorry @dxiaosa I don't understand the question... do you mean to use scipy dendrograms for example?
@dxiaosa are you asking if matplotlib will be an optional backend for ete3?
@ fransua Sorry about reply until now, I just missed it. I mean, whether it could be done with matplotlib backend, so we can directly manipulate the tree components in graph.
@ jolespin Yes, that is it, then we can manipulate the tree components in matplotlib figure object!
Hi @dxiaosa,
indeed it would be nice, but it would take a considerable amount of time to implement it... and to maintain it.
On my side, it's not going to be possible... but I would be happy to help if someone takes the lead :P
thanks for the interest! :)
@ fransua Great, thanks for attention and your help!
Very nice, thank you for this code! There were some minor errors when I tried to run it, so I made a fork with minor edits fixing the issues. Also added an extra argument to control the printed leaf names. Feel free to include the edits in your original code.
should add this to header:
import matplotlib.pyplot as plt
Test representing the similarity with the Qt5 builtin front-end:
matplotlib output:
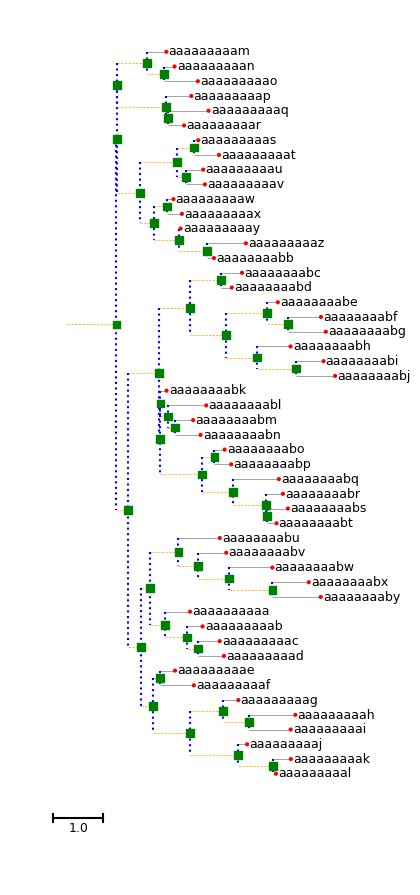
ETE3 builtin output:
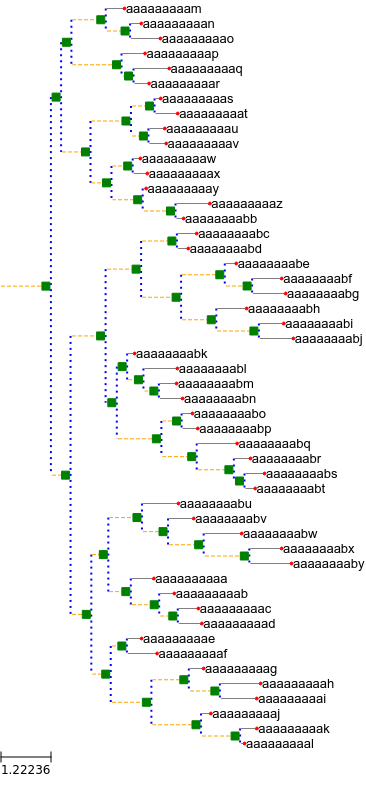
Using matplotlib with these kind of simple trees is ~2 times slower than using ETE3.