Tired of writing console.log when debugging React? Want to use a debugger with breakpoints, stopping React and taking the time to analyze variables?
Welcome to adding a debugger for frontend development:)
You must have PyCharm, WebStorm, or an equivalent Intellij IDEA/JetBrain IDE. The current instructions are written for Chrome development; other browsers may work but are not listed here.
You can find instructions on how to do it from the JetBrain docs, though the below is more clear.
If you use WebStorm, skip to that section below. If the instructions are incorrect, use the documentation directly
-
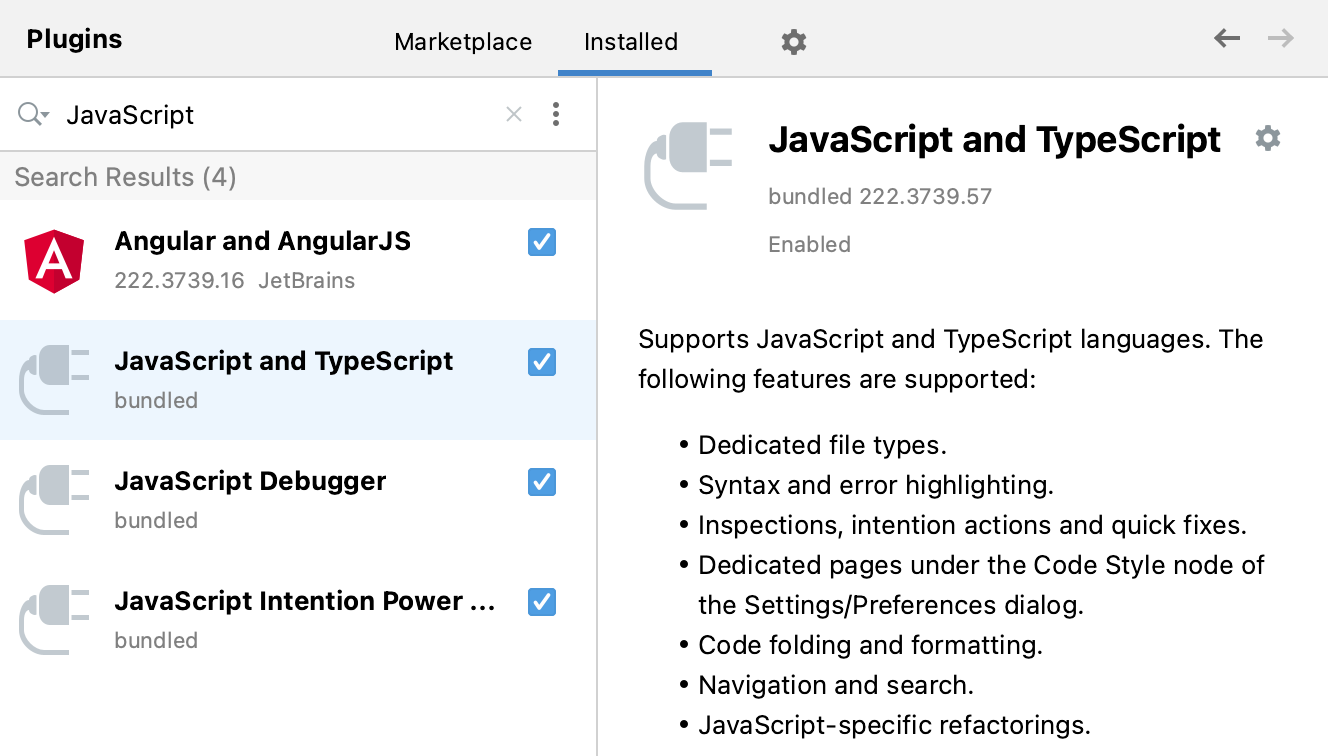
Make sure the JavaScript and TypeScript bundled plugin is enabled in the settings. Press ⌘Cmd + 0, to open the IDE settings and then select Plugins. Click the Installed tab. In the search field, type JavaScript and TypeScript. For more details about plugins, see Managing plugins.
-
Make sure the JavaScript Debugger bundled plugin is enabled in the settings. Press ⌘Cmd + 0, to open the IDE settings and then select Plugins. Click the Installed tab. In the search field, type JavaScript Debugger. For more details about plugins, see Managing plugins.
-
You can check that the JavaScript Debugger is installed by opening your run configurations at the top and adding a new run configuration titled JavaScript Debugger.
If the instructions seem wrong, visit troubleshooting or head to the direct documentation.
- Open Settings/Preferences
- Go to Tools > Web Browsers and Previews
- Add a new browser and name it New Tab Chrome. Ensure Chrome is selected as the browser.
- Edit the row via the pencil icon and paste in an absolute path to your Chrome user data directory under the label “Use custom user data directory”. This doc details how to find it, or follow my template below:
/Users/andrew/Library/Application Support/Google/Chrome
Change andrew to your current user directory.

-
After saving, press the dropdown beside “Default Browser” and select “First listed”. Then, select the “New Tab Chrome” row and, using the up arrow beside the pencil, move the row to the top.

-
Quit Chrome. If it has this dot in your dock at the bottom, you should hold down on the icon in your dock and force quit.

-
Head to your run configurations (it may say “Current File”) and press “Edit Configurations…”

-
Press the “+” button (or Add New) at the top left and select JavaScript Debugger
-
Set the url to where React is hosted (in my case, http://localhost:3000) and ensure the browser is set to New Tab Chrome

-
Finally, press the Debug 🪲 button and Google Chrome should appear. Assuming your frontend service is running too, Lumos should appear.
-
To test a breakpoint, go anywhere in the frontend code and set a breakpoint by left clicking next to the line number, and a red dot should appear. Right clicking the right dot allows you to set conditions.

- Pressing the debug button opens a new Chrome profile instead of the current one I’m using:
- Ensure you force quit Chrome. You can do this by pressing the 🍎 Apple icon at the top left, select “Force Quit”, select Chrome, and force quit Chrome.
- The reason we do this is because the IDE sets a “debugger” flag when opening Chrome. By default, the debugger flag is not set when you open Chrome, so any time you develop in the frontend, ensure you have Chrome completely not running!