- Which district has more cases?
- Total survived cases across country?
- Geographical pattern of pandemic spread?
- Rate of survival across districts?
- What is the recovery rate across countries, districts, state?
- Rate of new cases across districts?
- Total active cases in India?
- Datewise new cases in India?
- To understand the relation between new and death cases
Hierarchical clustering algorithms group similar objects into groups called clusters. There are two types of hierarchical clustering algorithms:
- Agglomerative — Bottom up approach. Start with many small clusters and merge them together to create bigger clusters.
- Divisive — Top down approach. Start with a single cluster than break it up into smaller clusters.
Create a Hierarical clustering and experiment the following tutorial

Dataset This given dataset consists of the following datapoints
id- unique ID for excerpturl_legal- URL of source - this is blank in the test set.license- license of source material - this is blank in the test set.excerpt- text to predict reading ease oftarget- reading ease
We'll use k-means to discover clusters in a data set using unsupervised learning. The original data can be found here
https://ufile.io/39bbkph1
From the Unified Crime Reporting Statistics and under the collaboration of the U.S. Department of Justice and the Federal Bureau of Investigation information crime statistics are available for public review. The following data set has information on the crime rates and totals for states across the United States for a wide range of years. The crime reports are divided into two main categories: property and violent crime. Property crime refers to burglary, larceny, and motor related crime while violent crime refers to assault, murder, rape, and robbery. These reports go from 1960 to 2012.
The analysis consists of the following steps.
- I. Importing necessary libraries and downloading the data
This file contains bidirectional Unicode text that may be interpreted or compiled differently than what appears below. To review, open the file in an editor that reveals hidden Unicode characters.
Learn more about bidirectional Unicode characters
| <?php | |
| // Compose the mail | |
| $to = "imail@example.co.uk"; | |
| $subject = "Enquiry from Example"; | |
| $headers = "From: " . strip_tags($_POST['email']) . "\r\n"; | |
| $headers .= "Reply-To: ". strip_tags($_POST['email']) . "\r\n"; | |
| $headers .= "CC: email@gmail.com\r\n"; | |
| $headers .= "MIME-Version: 1.0\r\n"; | |
| $headers .= "Content-Type: text/html; charset=ISO-8859-1\r\n"; |
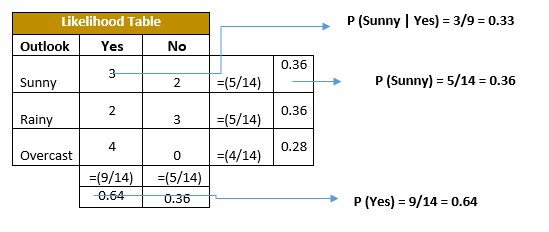
Naive Bayes methods are a set of supervised learning algorithms based on applying Bayes' theorem with the “naive” assumption of conditional independence between every pair of features given the value of the class variable.

Use the above dataframe as reference and build a Naive Bayes Classifier using python. Follow the guidelines.
- Build a production ready classifier following the API interfaces.
In linear algebra, the singular value decomposition (SVD) is a factorization of a real or complex matrix that generalizes the eigendecomposition of a square normal matrix to any. matrix via an extension of the polar decomposition.

Multidimensional scaling is a powerful technique used to visualize in 2-dimensional space the (dis)similarity among objects. The idea is that we can derive to what extent two objects are similar, based on the geometric distance they exhibit in the 2D plan.
There is no pca() function in NumPy, but we can easily calculate the Principal Component Analysis step-by-step using NumPy functions. The example below defines a small 3×2 matrix, centers the data in the matrix, calculates the covariance matrix of the centered data, and then the eigendecomposition of the covariance matrix. The eigenvectors and eigenvalues are taken as the principal components and singular values and used to project the original data.
from numpy import array
from numpy import mean
from numpy import cov
BastinRobin
/ PCA.py
Last active
March 10, 2021 08:36
Manually Calculate Principal Component Analysis
This file contains bidirectional Unicode text that may be interpreted or compiled differently than what appears below. To review, open the file in an editor that reveals hidden Unicode characters.
Learn more about bidirectional Unicode characters
| ## PCA | |
| There is no pca() function in NumPy, but we can easily calculate the Principal Component Analysis step-by-step using NumPy functions. | |
| The example below defines a small 3×2 matrix, centers the data in the matrix, calculates the covariance matrix of the centered data, and then the eigendecomposition of the covariance matrix. The eigenvectors and eigenvalues are taken as the principal components and singular values and used to project the original data. | |
| from numpy import array | |
| from numpy import mean | |
| from numpy import cov |
This exercise is created to make you confident in building multiple regression models using spreadsheets.
This dataset contains information collected by the U.S Census Service concerning housing in the area of Boston Mass. It was obtained from the StatLib archive, and has been used extensively throughout the literature to benchmark algorithms. However, these comparisons were primarily done outside of Delve and are thus somewhat suspect. The dataset is small in size with only 506 cases.
- Download the dataset using this link https://gofile.io/d/YZUprY
- Use MS Excel to build a Multiple Regression Models
- Audit the regression summary and elimate features which are not significant.
- Predict the house price
MEDV.