Last active
August 9, 2019 17:50
-
-
Save Beomi/d07e83ad57aeb1cd1fd49eb8d29a6402 to your computer and use it in GitHub Desktop.
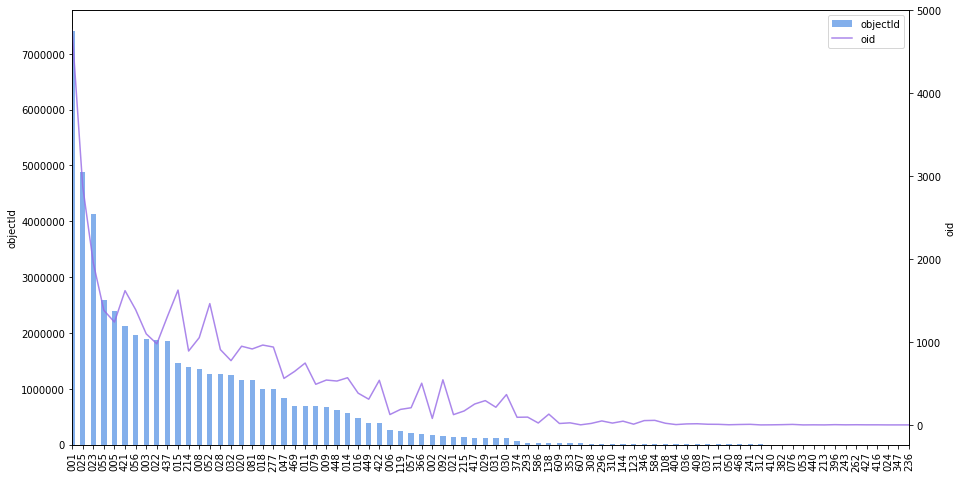
Pandas Multi Column 그리기
This file contains bidirectional Unicode text that may be interpreted or compiled differently than what appears below. To review, open the file in an editor that reveals hidden Unicode characters.
Learn more about bidirectional Unicode characters
| def plot_multi(data, cols=None, spacing=.1, **kwargs): | |
| from pandas import plotting | |
| # Get default color style from pandas - can be changed to any other color list | |
| if cols is None: cols = data.columns | |
| if len(cols) == 0: return | |
| # colors = getattr(getattr(plotting, '_style'), '_get_standard_colors')(num_colors=len(cols)) | |
| # colors = [rand_color.generate() for _ in range(len(cols))] | |
| # colors = rand_color.generate(hue="blue", count=len(cols)) | |
| # colors = [((i*50)/255, 1-(i*50)/255, 0.9, 0.8) for i in range(2, len(cols)+2)] | |
| colors = [f'C{str(i)[-1]}' for i in range(len(cols))] | |
| # First axis | |
| ax = data.loc[:, cols[0]].plot(label=cols[0], color=colors[0], **kwargs) | |
| ax.set_ylabel(ylabel=cols[0]) | |
| lines, labels = ax.get_legend_handles_labels() | |
| for n in range(1, len(cols)): | |
| # Multiple y-axes | |
| ax_new = ax.twinx() | |
| ax_new.spines['right'].set_position(('axes', 1 + spacing * (n - 1))) | |
| data.loc[:, cols[n]].plot(ax=ax_new, label=cols[n], color=colors[n % len(colors)]) | |
| ax_new.set_ylabel(ylabel=cols[n]) | |
| # Proper legend position | |
| line, label = ax_new.get_legend_handles_labels() | |
| lines += line | |
| labels += label | |
| ax.legend(lines, labels, loc=0) | |
| return ax |
Author
Beomi
commented
Aug 9, 2019

Change color to blue
Sign up for free
to join this conversation on GitHub.
Already have an account?
Sign in to comment