Last active
June 13, 2019 11:39
-
-
Save CYHSM/6d56604162e1d849432ceb37369995ac to your computer and use it in GitHub Desktop.
This file contains bidirectional Unicode text that may be interpreted or compiled differently than what appears below. To review, open the file in an editor that reveals hidden Unicode characters.
Learn more about bidirectional Unicode characters
| # Imports | |
| import numpy as np | |
| from sklearn.datasets import make_blobs | |
| import matplotlib.pyplot as plt | |
| plt.xkcd(); | |
| import seaborn as sns | |
| sns.set_style('white') | |
| # Set transparency off when exporting / Only if you want to save the figure | |
| from matplotlib import patheffects, rcParams | |
| rcParams['path.effects'] = [patheffects.withStroke(linewidth=0)] | |
| # Set font | |
| font = {'family' : 'Caveat', | |
| 'size' : 14} | |
| plt.rc('font', **font) | |
| # Make sure its the same dataset | |
| np.random.seed(42*42) | |
| # Generate data from scikit learn make_blobs | |
| # Here it would also work to create a two-dimensional dataset, | |
| # for my purpose a slice through six-dimensional blobs gave better results | |
| X, y = make_blobs(n_samples=200, centers=2, n_features=6, cluster_std=3.5) | |
| X = X.astype(np.float32) | |
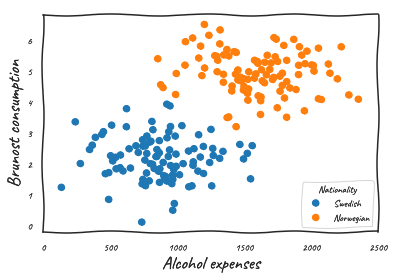
| # Plot data with matplotlib | |
| plt.plot(X[y>0,0], X[y>0,1], 'C0o') | |
| plt.plot(X[y<1,0]*-1, X[y<1,1], 'C1o') | |
| plt.legend(['Swedish', 'Norwegian'], loc='lower right', title='Nationality') | |
| plt.xlabel('Alcohol expenses', fontsize=18) | |
| plt.ylabel('Brunost consumption', fontsize=18) | |
| plt.gca().set_xticks([-9.,-4.,1.,6.,11.,16.]) | |
| plt.gca().set_xticklabels([0,500,1000,1500,2000,2500]) | |
| plt.gca().set_yticklabels([0,0,1,2,3,4,5,6,7]) | |
| plt.show() |
Sign up for free
to join this conversation on GitHub.
Already have an account?
Sign in to comment
Output: