Heroku only allows each dyno to send and receive external network traffic on a single port, which means you can't simply
run node --debug server.js and attach your debugger to your-app.herokuapp.com:5858.
To work around this, you can use ngrok and Heroku ngrok Buildpack to tunnel to the debugger's port and access it externally.
This guide assumes your application has already been set up. If it hasn't, read Heroku's Node.js Documentaion to get started.
Add the Heroku ngrok Buildpack to your application by following the author's instructions.
Make sure to set the AUX_PORT config value to the local port you want the debugger to run on and NGROK_COMMAND to
tcp.
You can also set NGROK_OPTS to pass additional options to ngrok.
Create a Bash script that will start your application in debug or release mode as appropriate.
Make sure your script is marked as executable, this can be done using chmod +x start.sh on Unix-like OSs or
git add --chmod=+x -- start.sh on Windows.
For debug mode, prefix the command with with_ngrok and add the --debug argument to node.
For example:
#!/bin/bash

if [ "$ENABLE_DEBUG" == "true" ]; then
	echo "Starting with debugger on port $AUX_PORT"
	exec with_ngrok node --debug=$AUX_PORT server.js
else
	echo "Starting without debugger"
	exec node server.js
fi
This allows you to start or stop debugging your application by changing the ENABLE_DEBUGGING config value to true
or false with the heroku config:set command.
In your Procfile or package.json, run the start script to start the application.
An example Procfile:
web: ./start.sh
worker: start-worker-process
An example package.json:
{
	"name": "my-application",
	"author": "Me",

	...

	"scripts": {
		"start": "./start.sh"
	},
	"engines": {
		"node": "0.12.x",
		"npm": "3.1.x"
	}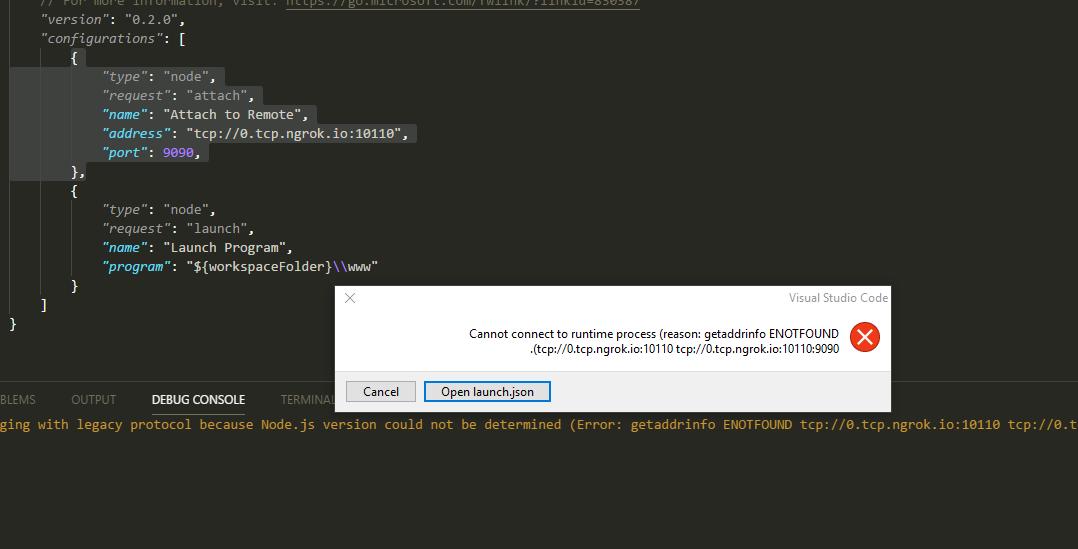
}If you're not using a reserved domain or TCP address, you'll need to use the
ngrok Dashboard to find the URL of your application's TCP tunnel.
This will be something like tcp://0.tcp.ngrok.io:18082.
Once you have your ngrok URL, you can attach your debugger to it.
Attach your debugger to the ngrok URL by following its documentation.
If you're using Node.js Tools for Visual Studio, follow these instructions.
Debug your application as normal.
Great stuff @Choonster, thanks for it. There is a small mistake:
start.shscript is usingENABLE_DEBUGenv variable, however docs later mentionENABLE_DEBUGGING