This is a mini-tutorial of sorts for getting started with gdb on the Switch, with the target audience being people who want to mod and/or reverse games, with no prerequisite knowledge of gdb. The goal will be to walk you through some of the basic workflows needed to use a debugger on the Switch, while being brief enough for skimming for when you forget things.
If some part is unclear, your OS doesn't have install instructions, or you feel part of your workflow should be added here, feel free to comment any additions.
(If you only need a quick reference Jump to the Appendix)
First off you'll need a version of GDB compatible with aarch64. This can be obtained via either a distribution of
aarch64-none-elf-gdb or gdb-multiarch. I personally use gdb-multiarch, however users of devkitpro or Windows
users may find it easier to aquire an aarch64-specific GDB.
aarch64-none-elf-gdb Install (Click to expand)
Install devkitpro if you haven't already.
- Install aarch64 gdb (Alternatively on Windows use the graphical installer, as it should come with the switch installation package, so you might even already have it installed):
dkp-pacman -Syu devkitA64-gdb
- Ensure devkitA64 is added to path. The path should look something like this:
- Linux -
/opt/devkitpro/devkitA64/bin - Windows -
C:/devkitpro/devkitA64/bin
- (Linux only) You may need libncurses to use devkitpro's GDB. It is available under
libncurses5on most distros' package managers.
gdb-multiarch Install (Click to expand)
sudo apt-get install -y gdb-multiarch
(Requires MSYS2 with msys2 pacman in PATH)
pacman -Syu mingw-w64-x86_64-gdb-multiarch
pacman -Syu gdb-multiarch
- Ensure your version of Atmosphere is at least version
1.2.4(System Settings → System → "Current version: ... | AMS X.Y.Z | ..." under the 'System Update' button) - Modify
sd:/atmosphere/config/system_settings.ini(or create it if it doesn't exist) and ensure the following values are set accordingly:
[atmosphere]
enable_htc = u8!0x0
enable_standalone_gdbstub = u8!0x1- Reboot your Switch
Note: this portion is subject to change if Atmosphere ever removes the standalone GDB stub. If so this section will need to be updated for Atmosphere's Starlink once it is ready for use, which will also enable debugging the Switch over USB.
First find your Switch IP (System Settings → Internet → "IP Address") and ensure the computer you're using to connect to. Anywhere you see <ip addr> should be replaced with your Switch's IP, for example <ip addr>:22225 becomes 192.168.0.5:22225 if your Switch's IP is 192.168.0.5. (Note: your Switch will need to be on the same network as your computer for this to work)
- Open a terminal window and run GDB:
gdb-multiarch
or
aarch64-none-elf-gdb
- Run the following GDB command to connect to your Switch (note:
(gdb)is the prompt, you should only type/copy the part after it)
(gdb) target extended-remote <ip addr>:22225
- Tell the Switch GDB stub you're about to run an application
(gdb) monitor wait application
- Ignore any "packet error" messages and start up your game
- Your game will freeze and gdb will output "
Attach to 0xNN", where0xNNis the process ID of your game. - Finish attaching to the game (replace 0xNN with your process ID):
(gdb) attach 0xNN
- If everything worked you should now see something akin to the following:
Attaching to process 146
warning: Application: No such file or directory.
0x0000001040200000 in ?? ()
=> 0x0000001040200000:	02 00 00 14	b	0x1040200008
Terms to Know (Click to expand)
- Breakpoint - a location in the code to stop execution for debugging when the location's code is about to run
- Register - a named temporary storage location provided by the CPU used for all calculations
- Watchpoint - a location in memory to stop execution when it's accessed, basically a breakpoint but for data instead of code
- Program Counter - a value representing the position in the code that is currently executing
- Pointer - a memory address which "points" to some data of a given type
- Endian - the byte order of a number stored in memory. The Switch is a little endian system, so numbers stored in memory have their bytes reversed.
- Module - an executable loaded into memory. (
main, nnsdk, NROs,subsdks, etc) - Offset - a location relative to the start of something, in the case of debugging usually the start of the relevant module.
- Section - a portion of a module with a given purpose. The most relevant sections are
.text(the code),.data(global writable data), and.rodata(read-only global data). - Heap - miscellaneous memory from which the game can request a section of memory (allocation) and then later return it (deallocation/freeing memory)
- Thread - multiple bits of code can run at the same time, each individual bit of code being its own "thread" of execution
- Symbol - a label which points to a given function or value. For example
nn::os::StartThread(an nnsdk function for starting a thread) ornnMain(where themainexecutable of the game starts execution) - Stack - the storage location for local variables in memory, each function reserves some memory on the top of the stack (by subtracting from the 'stack pointer') then at the end of the function returns the memory (by adding to the stack pointer)
- Arguments - functions can take "arguments" or values which are passed to it. The passing of arguments uses a standard set of registers (calling convention) so we can know which registers map to which argument (for example
X0will be the first integer/pointer argument)
The general process of debugging will be finding a point in the code in which we would like to stop execution and observe the values stored in either registers or in memory (usually in memory pointed to by the registers at the point in time). Typically this is done by locating potentially relevant code in GHIDRA/IDA and then setting a breakpoint at the offset in our module where we want to observe the system state.
For example if we have the following function in GHIDRA:
                      nnMain                                          XREF[1]:     Entry Point(*)
71003071a0 ff c3 00 d1     sub        sp,sp,#0x30
71003071a4 fe 0b 00 f9     str        x30,[sp, #local_20]
71003071a8 f4 4f 02 a9     stp        x20,x19,[sp, #local_10]
71003071ac e0 63 00 91     add        x0,sp,#0x18
71003071b0 b0 7b 00 94     bl         nn::fs::QueryMountRomCacheSize                   undefined QueryMountRomCacheSize
Let's say we want to see the value of the stack pointer (sp) at the start of the nnMain function. First off we need to get the offset of nnMain. For the GHIDRA Switch Loader, our game will be loaded at 0x7100000000, so to get the offset from our disassebly above we can just chop of the 71 part of the address. So our offset of nnMain (relative to the start of our binary) is 0x3071a0.
- First up we need to locate the start of our module:
(gdb) monitor get info
Process:     0x92 (Application)
Program Id:  0x01007ec013abc000
Application: 1
Hbl:         0
Layout:
  Alias: 0x2146400000 - 0x31463fffff
  Heap:  0x31cec00000 - 0x334ebfffff
  Aslr:  0x0008000000 - 0x7fffffffff
  Stack: 0x7c21400000 - 0x7ca13fffff
Modules:
  0x1040200000 - 0x1040201fff nnrtld.elf
  0x1040204000 - 0x10558dbfff Spel2.nss
  0x1056a48000 - 0x1056fd7fff nnSdk.elf
- The relevant module here is
Spel2.nss(this will be named after your game) and so the load address of it is0x1040204000, so lets set a breakpoint relative to it:
b *<address>+<offset>
filling in our module adddress/offset we get:
(gdb) b *0x1040204000+0x3071a0
- Now we want to continue (allow the game to start running so it can reach the point where it hits our breakpoint)
(gdb) c
- Our breakpoint should get hit a few seconds after the above is run. Let's print out the next 5 instructions so we know we're at the right place:
(gdb) x/5i $pc
=> 0x104050b1a0:	sub	sp, sp, #0x30
   0x104050b1a4:	str	x30, [sp, #16]
   0x104050b1a8:	stp	x20, x19, [sp, #32]
   0x104050b1ac:	add	x0, sp, #0x18
   0x104050b1b0:	bl	0x104052a070
- Now lets print out our stack pointer:
(gdb) p/x $sp
- And since our current instruction modifies the stack pointer, lets see that in action. First up let's "step" to the next instruction:
(gdb) si
- And finally let's print the stack pointer again (same command as above), and it is
0x30smaller than before (sub sp,sp,#0x30)
Note: If you relaunch the game it will get a new process ID and memory location, be sure to either restart gdb or disable your breakpoints before attaching to a new session.
When you're done, make sure to detatch GDB before closing the game to avoid unnecessary issues and freezes.
Print a null-terminated string pointed to by the register $x0:
p (char*)$x0
Break if the process writes to the integer at offset +0x158620de:
watch *(int*)0x1040204000+0x158620de
Break if the process reads the integer from offset +0x158620de:
rwatch *(int*)0x1040204000+0x158620de
Break if the process accesses (reads from or writes to) the integer at offset +0x158620de:
awatch *(int*)0x1040204000+0x158620de
monitor get mappings
Print the call stack of which functions called the current function:
bt
Note: in a lot of cases code running on the Switch don't present callstack frames in a manner GDB can understand. See the Other Tips section's Alternate Backtrace for another option.
| Short | Long | Info | Example |
|---|---|---|---|
b |
break |
Set a breakpoint at a given point, common form: b *<address>, where <address> can be an expression |
b *0x1234+0x5 |
c |
continue |
Resume (or start) execution | |
p |
print |
Print a value. | print sp as hex: p/x $sp, print x0 as string: p (char*)$x0 |
x |
Print memory at a location (More Info) | print 4 64-bit numbers at x0: x/4g, print the first 6 bytes on the stack: x/6b $sp |
|
si |
Step a single instruction | ||
bt |
Print a backtrace | ||
watch |
Write-only watchpoint | watch *(char*)$x5 |
|
rwatch |
Read-only watchpoint | rwatch *(void**)$x5 |
|
awatch |
Watchpoint | awatch *(int*)$sp |
|
mon |
monitor |
Switch-specific gdb commands | monitor help |
x/Ni <expr> |
Disassemble N instructions at location <expr> |
print the next 3 instructions: x/3i $pc |
|
target extended-remote |
Attach to a remote target. Atmosphere uses port 22225. | target extended-remote 192.168.1.31:22225 |
|
attach |
Attach to a given process ID | attach 0x33 |
|
info break |
List breakpoints | ||
info watch |
List watchpoints | ||
info os processes |
List all running processes | ||
delete breakpoints |
Delete all breakpoints |
| Command | Info |
|---|---|
monitor get info |
Get process info, address space layout, and information on modules |
monitor get mappings |
Get all memory mappings |
monitor wait application |
Causes the stub to wait for an application to be launched. The next application will be started suspended until the user runs attach [pid] |
monitor wait homebrew |
|
monitor wait {program id} |
Causes the stub to wait for a given program id to be launched then haults it until its pid is attached to |
monitor help |
List monitor commands |
Set the following in your GDB init file (~/.gdbinit) where ~ is your user's home directory:
set  disassemble-next-line on
show disassemble-next-line
this will have it print out the current instruction whenever you hit a breakpoint, making it easier to understand what's going on.
It's more common for code on the Switch to use the frame pointer in a chain to express callstack frames, in order to use fp-walking for a backtrace here's a snippet (Thanks to @SciresM):
define my_bt
  set $frame = $fp
  set $prev_frame = 0
  while $frame != 0 && $prev_frame != $frame
      set $prev_frame = $frame
      p/x ((unsigned long long *)$frame)[1]
      set $frame = ((unsigned long long *)$frame)[0]
  end
end
You can add this to your .gdbinit file and run this using:
(gdb) my_bt
GDB init (.gdbinit) files can also be stored outside the home directory, so if you always do your debugging from, say, ~/dev/switch/ then you can create a file called ~/dev/switch/.gdbinit and have it include the following:
target extended-remote <ip addr>:22225
monitor wait application
And it will automatically start waiting for an application to start when you launch gdb from that folder.
Note: By default gdb prevents this for security reasons, so in order to mark it as safe, add the following line to ~/.gdbinit:
add-auto-load-safe-path <path to new .gdbinit file>
Example:
add-auto-load-safe-path /home/jam/dev/switch/.gdbinit
Rather than use a specific directory, you can also use an alias which does something similar. For example if your shell is bash you can add the following line to your .bashrc:
alias gdb-switch='gdb-multiarch -ex "target extended-remote 192.168.86.27:22225" -ex "monitor wait application"'
Which will add a gdb-switch command which will automatically connect to the switch and wait for an application.
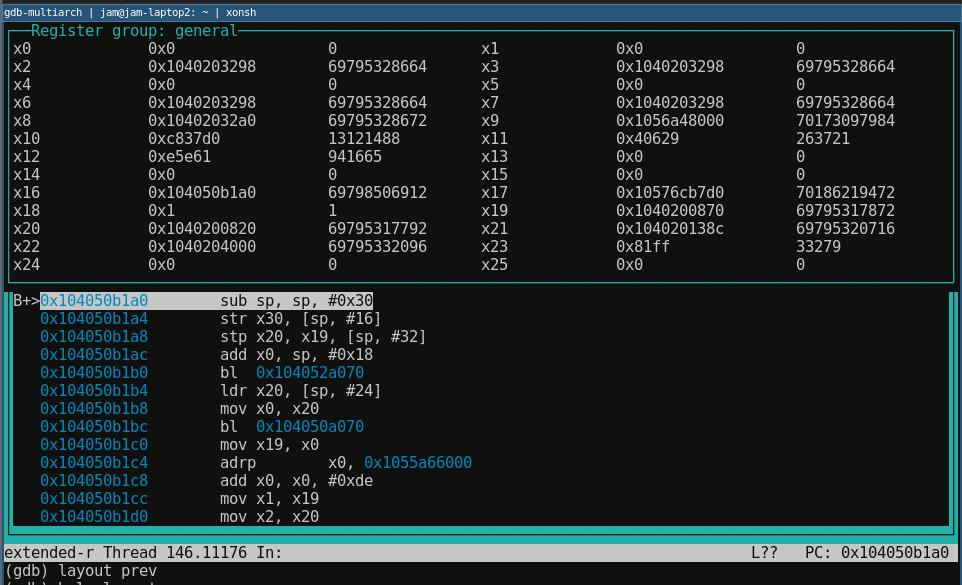
GDB TUI isn't super amazing, but sometimes it's a nice choice and I'm sure some people swear by it. To active it use the command layout asm in a compatible version of gdb in ANSI compatible terminals:

Or to display registers use layout regs: