Last active
January 6, 2021 13:58
-
-
Save DMTSource/93b36f152692f8ae62d2e47af25e7520 to your computer and use it in GitHub Desktop.
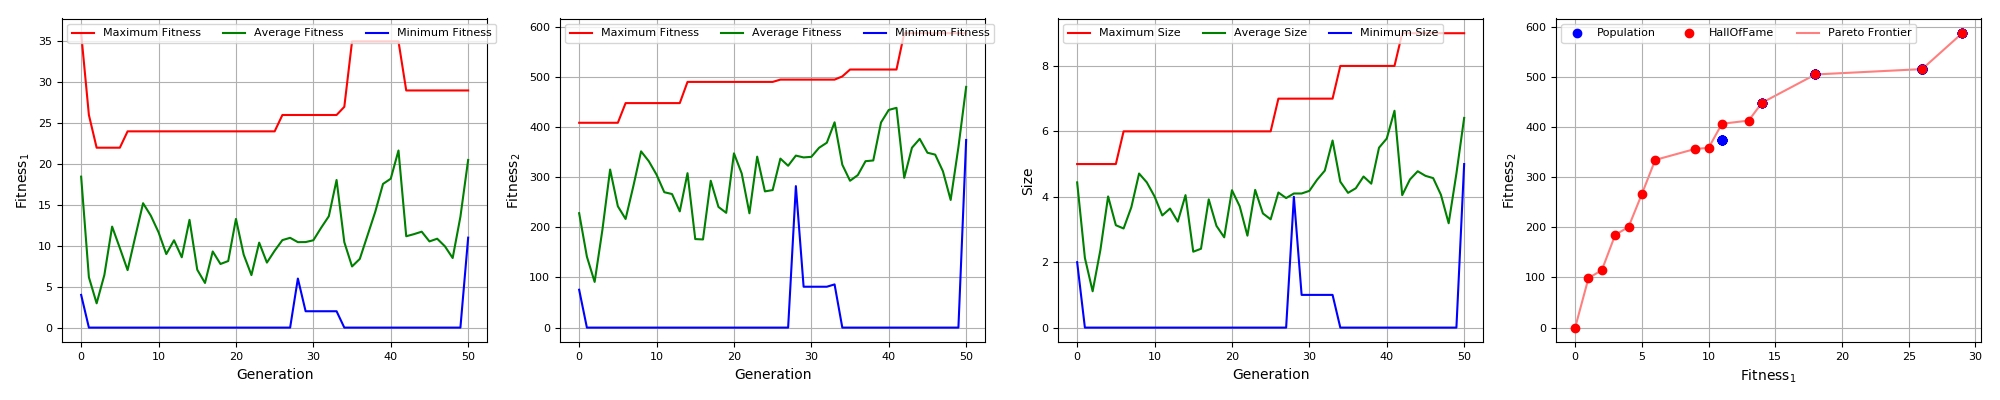
DEAP multi objective plotting example
This file contains bidirectional Unicode text that may be interpreted or compiled differently than what appears below. To review, open the file in an editor that reveals hidden Unicode characters.
Learn more about bidirectional Unicode characters
| # Example of multi objective plotting in Deap | |
| # Derek M Tishler - 2018 | |
| import numpy as np | |
| import matplotlib.pyplot as plt | |
| plt.rc('xtick', labelsize=8) | |
| plt.rc('ytick', labelsize=8) | |
| def plot_deap_multi(population, halloffame,logbook): | |
| gen = logbook.select("gen") | |
| fit_1_maxs = np.array(logbook.chapters["fitness"].select("max"))[:,0] | |
| fit_1_avgs = np.array(logbook.chapters["fitness"].select("avg"))[:,0] | |
| fit_1_mins = np.array(logbook.chapters["fitness"].select("min"))[:,0] | |
| fit_2_maxs = np.array(logbook.chapters["fitness"].select("max"))[:,1] | |
| fit_2_avgs = np.array(logbook.chapters["fitness"].select("avg"))[:,1] | |
| fit_2_mins = np.array(logbook.chapters["fitness"].select("min"))[:,1] | |
| size_maxs = logbook.chapters["size"].select("max") | |
| size_avgs = logbook.chapters["size"].select("avg") | |
| size_mins = logbook.chapters["size"].select("min") | |
| fig = plt.figure(figsize=(20,4)) | |
| ax1 = plt.subplot2grid((1, 4), (0, 0)) | |
| ax1.plot(gen, fit_1_maxs, "r-", label="Maximum Fitness") | |
| ax1.plot(gen, fit_1_avgs, "g-", label="Average Fitness") | |
| ax1.plot(gen, fit_1_mins, "b-", label="Minimum Fitness") | |
| ax1.set_xlabel("Generation") | |
| ax1.set_ylabel(r"Fitness$_1$") | |
| plt.grid() | |
| plt.legend(ncol=3, fontsize=8, loc='upper left') | |
| ax2 = plt.subplot2grid((1, 4), (0, 1)) | |
| ax2.plot(gen, fit_2_maxs, "r-", label="Maximum Fitness") | |
| ax2.plot(gen, fit_2_avgs, "g-", label="Average Fitness") | |
| ax2.plot(gen, fit_2_mins, "b-", label="Minimum Fitness") | |
| ax2.set_xlabel("Generation") | |
| ax2.set_ylabel(r"Fitness$_2$") | |
| plt.grid() | |
| plt.legend(ncol=3, fontsize=8, loc='upper left') | |
| ax3 = plt.subplot2grid((1, 4), (0, 2)) | |
| ax3.plot(gen, size_maxs, "r-", label="Maximum Size") | |
| ax3.plot(gen, size_avgs, "g-", label="Average Size") | |
| ax3.plot(gen, size_mins, "b-", label="Minimum Size") | |
| ax3.set_xlabel("Generation") | |
| ax3.set_ylabel("Size") | |
| plt.grid() | |
| plt.legend(ncol=3, fontsize=8, loc='upper left') | |
| ax4 = plt.subplot2grid((1, 4), (0, 3)) | |
| ax4.plot([ind.fitness.values[0] for ind in population], | |
| [ind.fitness.values[1] for ind in population], "bo", label="Population") | |
| ax4.plot([ind.fitness.values[0] for ind in halloffame], | |
| [ind.fitness.values[1] for ind in halloffame], "ro", label="HallOfFame") | |
| ax4.plot([ind.fitness.values[0] for ind in halloffame], | |
| [ind.fitness.values[1] for ind in halloffame], "r-", label="Pareto Frontier", zorder=0, alpha=0.5) | |
| ax4.set_xlabel(r"Fitness$_1$") | |
| ax4.set_ylabel(r"Fitness$_2$") | |
| plt.grid() | |
| plt.legend(ncol=3, fontsize=8, loc='upper left') | |
| plt.tight_layout() | |
| plt.show() | |
| plt.savefig('monitor.png') | |
| # The following is the knapsack.py example from github, slightly edited for multiob stats | |
| # https://github.com/DEAP/deap/blob/master/examples/ga/knapsack.py | |
| # This file is part of DEAP. | |
| # | |
| # DEAP is free software: you can redistribute it and/or modify | |
| # it under the terms of the GNU Lesser General Public License as | |
| # published by the Free Software Foundation, either version 3 of | |
| # the License, or (at your option) any later version. | |
| # | |
| # DEAP is distributed in the hope that it will be useful, | |
| # but WITHOUT ANY WARRANTY; without even the implied warranty of | |
| # MERCHANTABILITY or FITNESS FOR A PARTICULAR PURPOSE. See the | |
| # GNU Lesser General Public License for more details. | |
| # | |
| # You should have received a copy of the GNU Lesser General Public | |
| # License along with DEAP. If not, see <http://www.gnu.org/licenses/>. | |
| import random | |
| import numpy | |
| from deap import algorithms | |
| from deap import base | |
| from deap import creator | |
| from deap import tools | |
| IND_INIT_SIZE = 5 | |
| MAX_ITEM = 50 | |
| MAX_WEIGHT = 50 | |
| NBR_ITEMS = 20 | |
| # To assure reproductibility, the RNG seed is set prior to the items | |
| # dict initialization. It is also seeded in main(). | |
| random.seed(64) | |
| # Create the item dictionary: item name is an integer, and value is | |
| # a (weight, value) 2-uple. | |
| items = {} | |
| # Create random items and store them in the items' dictionary. | |
| for i in range(NBR_ITEMS): | |
| items[i] = (random.randint(1, 10), random.uniform(0, 100)) | |
| creator.create("Fitness", base.Fitness, weights=(-1.0, 1.0)) | |
| creator.create("Individual", set, fitness=creator.Fitness) | |
| toolbox = base.Toolbox() | |
| # Attribute generator | |
| toolbox.register("attr_item", random.randrange, NBR_ITEMS) | |
| # Structure initializers | |
| toolbox.register("individual", tools.initRepeat, creator.Individual, | |
| toolbox.attr_item, IND_INIT_SIZE) | |
| toolbox.register("population", tools.initRepeat, list, toolbox.individual) | |
| def evalKnapsack(individual): | |
| weight = 0.0 | |
| value = 0.0 | |
| for item in individual: | |
| weight += items[item][0] | |
| value += items[item][1] | |
| if len(individual) > MAX_ITEM or weight > MAX_WEIGHT: | |
| return 10000, 0 # Ensure overweighted bags are dominated | |
| return weight, value | |
| def cxSet(ind1, ind2): | |
| """Apply a crossover operation on input sets. The first child is the | |
| intersection of the two sets, the second child is the difference of the | |
| two sets. | |
| """ | |
| temp = set(ind1) # Used in order to keep type | |
| ind1 &= ind2 # Intersection (inplace) | |
| ind2 ^= temp # Symmetric Difference (inplace) | |
| return ind1, ind2 | |
| def mutSet(individual): | |
| """Mutation that pops or add an element.""" | |
| if random.random() < 0.5: | |
| if len(individual) > 0: # We cannot pop from an empty set | |
| individual.remove(random.choice(sorted(tuple(individual)))) | |
| else: | |
| individual.add(random.randrange(NBR_ITEMS)) | |
| return individual, | |
| toolbox.register("evaluate", evalKnapsack) | |
| toolbox.register("mate", cxSet) | |
| toolbox.register("mutate", mutSet) | |
| toolbox.register("select", tools.selNSGA2) | |
| def main(): | |
| random.seed(64) | |
| NGEN = 50 | |
| MU = 100 | |
| LAMBDA = 2*MU | |
| CXPB = 0.6 | |
| MUTPB = 0.02 | |
| pop = toolbox.population(n=MU) | |
| hof = tools.ParetoFront() | |
| # switched to multi with size for general gp example, but multistats is needed for easier selection from log? | |
| stats_fit = tools.Statistics(lambda ind: ind.fitness.values) | |
| stats_size = tools.Statistics(len) | |
| stats = tools.MultiStatistics(fitness=stats_fit, size=stats_size) | |
| stats.register("avg", numpy.mean, axis=0) | |
| stats.register("std", numpy.std, axis=0) | |
| stats.register("min", numpy.min, axis=0) | |
| stats.register("max", numpy.max, axis=0) | |
| pop, log = algorithms.eaMuPlusLambda(pop, toolbox, MU, LAMBDA, CXPB, MUTPB, NGEN, stats, | |
| halloffame=hof) | |
| plot_deap_multi(pop, hof, log) | |
| return pop, stats, hof | |
| if __name__ == "__main__": | |
| main() |
Sign up for free
to join this conversation on GitHub.
Already have an account?
Sign in to comment
Example of the plot: