Last active
May 15, 2020 13:30
-
-
Save EoinTravers/245ba0d948e51a96bf19138615480e63 to your computer and use it in GitHub Desktop.
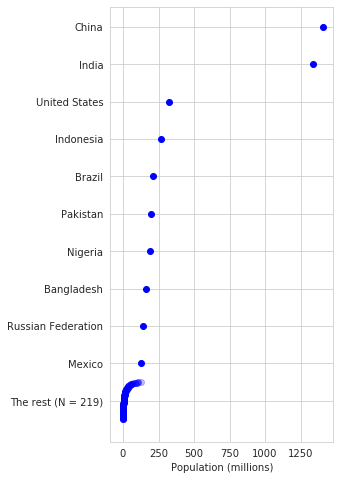
matplotlib: Plot the top N values, then squeeze in the rest
This file contains bidirectional Unicode text that may be interpreted or compiled differently than what appears below. To review, open the file in an editor that reveals hidden Unicode characters.
Learn more about bidirectional Unicode characters
| import numpy as np | |
| import matplotlib.pyplot as plt | |
| def plot_top(names, values, n_top=10, | |
| order=None, | |
| alpha=.25, | |
| ax=None, figsize=None): | |
| '''Plot the top N values, then squeeze in the rest | |
| Args: | |
| names: Array of labels | |
| values: Array of corresponding values | |
| n_top: How many values to plot. Default 10 | |
| order: Order of values. If None, go from high to low. | |
| alpha: Transparency for the remaining values | |
| ax: Axis to plot to. If None, create new axis. | |
| figsize: Size of new axis (width, height) | |
| Returns: | |
| ax: Plot axis | |
| ''' | |
| if order is None: | |
| order = np.argsort(values)[::-1] # Order from high to low | |
| names = np.array(names)[order] | |
| values = np.array(values)[order] | |
| drop = np.isnan(values) | |
| names, values = names[~drop], values[~drop] | |
| n_total = len(names) | |
| n_left = n_total - n_top | |
| # Plot top values | |
| if ax is None: | |
| fig, ax = plt.subplots(1, 1, figsize=figsize) | |
| plt.sca(ax) | |
| plt.scatter(values[:n_top], range(n_top), color='b') | |
| # Plot the rest in one go | |
| x = np.linspace(n_top - .5, n_top + .5, n_left) | |
| plt.scatter(values[n_top:], x, color='b', alpha=alpha) | |
| # Labels | |
| yticks = np.concatenate([names[:n_top], ['The rest (N = %i)' % n_left]]) | |
| plt.yticks(range(n_top+1), yticks) | |
| plt.gca().invert_yaxis() | |
| return ax | |
| # Example | |
| import pandas as pd | |
| import seaborn as sns | |
| sns.set_style('whitegrid') | |
| populations = pd.read_json('https://raw.githubusercontent.com/samayo/country-json/master/src/country-by-population.json') | |
| plot_top(populations['country'].values, | |
| populations['population'].values / 1000000, | |
| n_top=10, figsize=(4, 8)) | |
| plt.xlabel('Population (millions)') | |
| plt.show() |
Author
EoinTravers
commented
May 15, 2020
Sign up for free
to join this conversation on GitHub.
Already have an account?
Sign in to comment