import os
import sys
import bs4
import requests
import time
import json
from hashlib import sha256
from pathlib import Path
import random
u = 'https://tabelog.com/tokyo/A1301/'

def scan(u, page, chi):
    hs = sha256(bytes(u, 'utf8')).hexdigest()[:16]
    print('try', u)
    if Path(f'comps/{hs}').exists():
        return
    headers = {'User-agent': 'Mozilla/5.0 (Macintosh; Intel Mac OS X 10_13_3) AppleWebKit/537.36 (KHTML, like Gecko) Chrome/77.0.3865.90 Safari/537.36', 'referer': u}
    r = requests.get(u, headers=headers)
    soup = bs4.BeautifulSoup(r.text)

    lsts = soup.find_all('li', {'class': 'list-rst'})
    objs = []
    for lst in lsts:
        print(lst.text.replace('\n', ''))
        t = lst.find('a', {'class': 'cpy-rst-name'})
        s = lst.find('span', {'class': 'list-rst__rating-val'})
        rn = lst.find('em', {'class': 'list-rst__rvw-count-num cpy-review-count'})
        mise = t.text
        '''
        点が入っていないことがあるためハンドル
        '''
        if s is None:
            continue

        score = s.text
        review_num = rn.text
        obj = {'mise':mise, 'score':score, 'page':page, 'chi':chi, 'review_num':review_num}
        objs.append(obj)
    json.dump(objs, fp=open(f'comps/{hs}', 'w'), ensure_ascii=False, indent=2)
    print('complete', u)
    time.sleep(6.0)
scan(u, 0, -1)
while True:
    page = random.sample(list(range(1, 100)) , 1).pop()
    chi = random.sample([k for k in range(31)], 1).pop()
    print(chi)
scan(f'https://tabelog.com/tokyo/A13{chi:02d}/rstLst/{page}/', page, chi)28783件
from collections import Counter
import glob
import pandas as pd
import numpy as np
import json
import matplotlib.pyplot as plt


def force_to_int(x):
    try:
        return int(x)
    except:
        return -1


objs = []
for fn in glob.glob('./comps/*'):
    try:
        arr = json.loads(open(fn).read())
    except Exception as exc:
        print(exc)
        continue
    for obj in arr:
        print(obj)
        objs.append(obj)

df = pd.DataFrame(objs)
df.drop_duplicates(subset=['mise'], keep='last', inplace=True)
df['score'] = df.score.apply(float)
df['review_num'] = df.review_num.apply(force_to_int)
df.to_csv('out.csv', index=None)

for th in [0, 10, 20, 30, 40, 50, 60, 70, 80, 90]:
    df1 = df[df.review_num >= th]
    plt.figure(figsize=(30, 10))

    d = Counter(df1.score.tolist())
    df2 = pd.DataFrame([{'score':k, 'freq':v} for k, v in d.items()])
    ax = sns.barplot(x='score', y='freq', data=df2)
    ax.set_xticklabels(ax.get_xticklabels(), rotation=90)
    sns.set(font_scale=1.5)
    ax.set(xlabel='score', ylabel='freq', title=f'Hist over {th} in review_num, sample size {df1.shape[0]}')
    ax.figure.savefig(f'imgs/img_{th}.png')
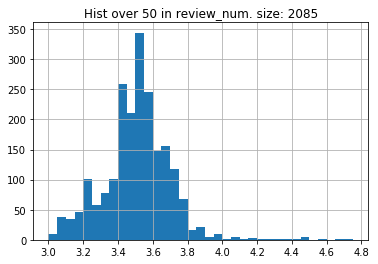
レビューの件数を何件で足切りするかでおおきく結果は変わってきそうである。
レビュー足切りなし
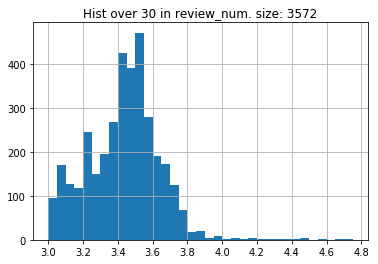
レビュー足切り30件
レビュー足切り90件
3.6、3.8以降の急激な頻出数の減少があり、何らかの意図が加わっていることが推察される。


