The GSoC period might be coming to an end, but the journey is not over yet. Here's the summary so far...
- Student: Isha Gupta
- Github: IshaGupta18
- Project Title: Sensor Data Upload & Display Libary
- Project Proposal: Proposal
- Project Repository: Simple-Data-Grapher
- Organization: Public Lab
- Public Lab Mirror of the Gist: Work Product GSoC'19
PS: Kindly refer to the Public Lab Mirror for better viewof the GIFs workings.
Simple-Data-Grapher is designed in a standalone repository. It is an HTML, CSS and JavaScript-based library, made in NodeJS through which a user can import CSV data, select different columns and graph types, and plot charts.
The user can import data through: - Local File: A file on the user's system - Remote File: A globally accessible file on the web - String: A CSV String - Google Sheet: A published Google Sheet
The headers are automatically detected, and assigned if not present.
A sample of the data is displayed for the user to choose columns for X and Y axes.
The user can choose from a variety of graph types, and the graphs can be plotted using PlotlyJS or ChartJS.
Peripheral Features:
- Download data as a spreadsheet
- Add graphs
- View and Export Data through CODAP
- Export Data to Google Drive (via CODAP)
- Save data for later use (on integration with plots2)
- Publish plotted graphs as a Research Note (on integration with plots2)
- Upload data from previously uploaded file (on integration with plots2)
- Save file description and title (on integration with plots2)
- View all uploaded files, delete and download them (on integration with plots2)
Links to Pull Requests in simple-data-grapher: Simple-Data-Grapher
Links to Pull Requests in plots2: Plots2
Links to Issues in simple-data-grapher: Issues in SDG
Links to Issues in plots2: Issues in plots2
Links to Commits in simple-data-grapher: Commits in SDG
Links to Commits in plots2: Commits in plots2
Github Pages demo: https://publiclab.github.io/simple-data-grapher/
Blogs: https://publiclab.org/profile/IshaGupta18

-
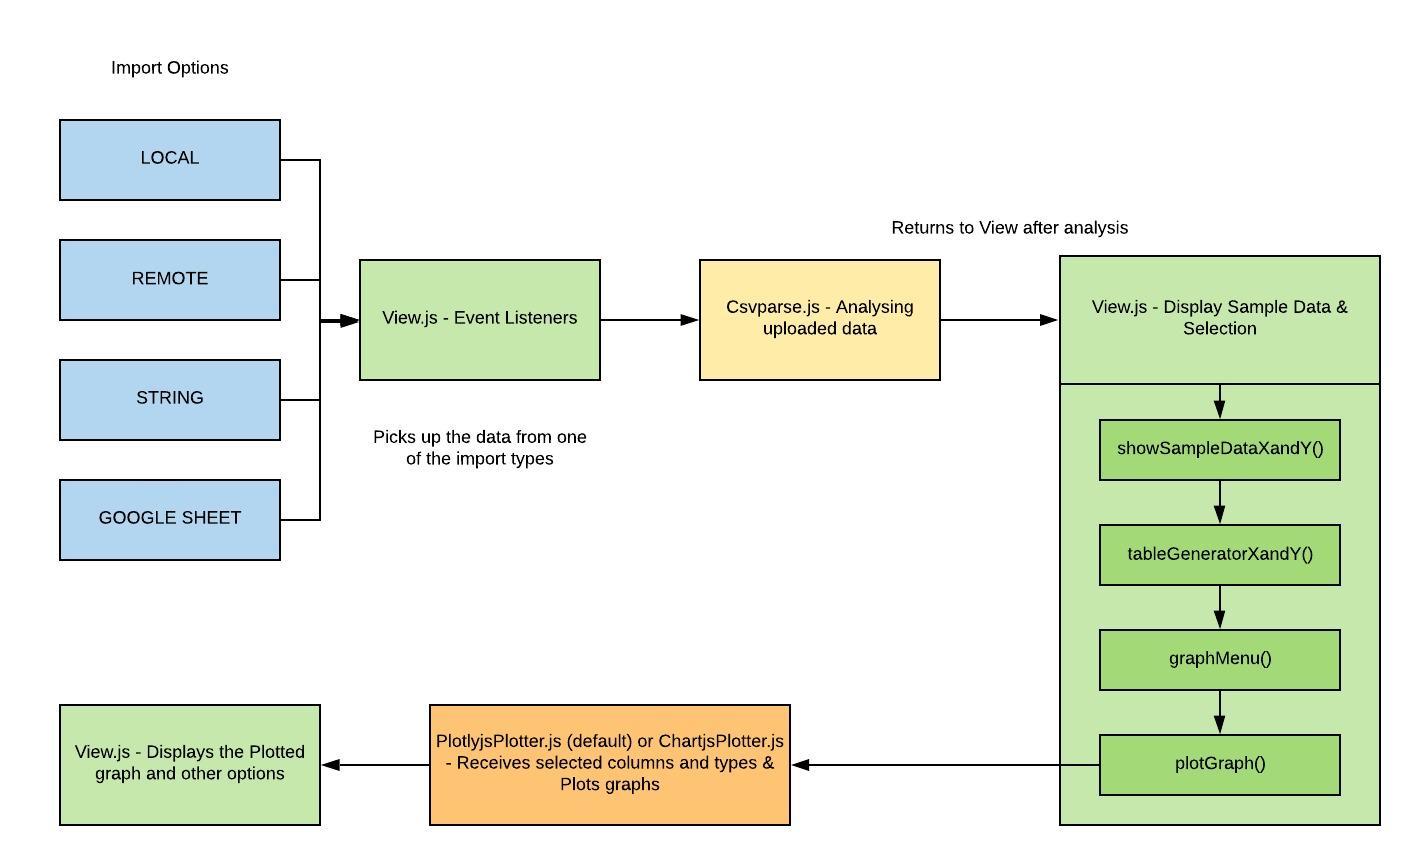
View.js: First reads the input files through the event listeners and sends the file to Csvparser.js, then once the required information is received, it displays a sample of the data. It then takes the selected data by the user, through the
afterSampleData()method, and goes to the plotting library, and displays the graph. -
Csvparser.js: Receives the file and it's format type and:
- Parses the CSV
- Determines headers
- Determines a matrix for the complete data
- Extracts sample data to be displayed to the user for selection
- Creates a transpose of the data
-
PlotlyjsPlotter.js (default) or ChartjsPlotter.js: Assembles the received data according to its format and plots the graph on the canvas element.
- Add Graph: It is checked at
showSampleDataXandY(), where the number of currently plotted graphs is incremented and it is sent as a flag, where the newly plotted graph has to be appended in the chart area, and not clear the canvas.

-
Create Spreadsheet: Uses the transpose created by Csvparser.js and creates a (excel or xlsx) spreadsheet using
SheetJSand downloads it. -
Download as Image: PlotlyJS offers the ability to download the graphs as an image. A feature for ChartJS was created separately.

- CODAP Export: CODAP is used here to view the CSV data in a proper tabular form. From there, the user can view a summary of their data, view a more readable form of it and use other tools that CODAP's Plugin API offers. The user can also export their data as a CSV directly to their Google Drive.

I created an adapter function which can easily switch between the two charting libraries, as one can be advantageous over the other in different situations.
- Plotlyjs is more extensively used than Chartjs
- Plotlyjs provides options like:
- Zooming
- Panning
- Autoscaling
- Downloading the graph as an image
- Box and Lasso select
- Edit graph in Plotlyjs editor
- Chartjs:
- Better comparison
- Better color scheme and design
- More informative tooltips
The basic flow remains the same as in the standalone library.
-
Save the data: The user can save their uploaded CSV and use it later for plotting.
-
Associate a file title and description with the uploaded data.

- Using previously uploaded data for plotting: Users can use their previously uploaded files for plotting in simple-data-grapher.

- Per-User Data Page: Lists down all the files a user has saved, their title & description. The user can delete as well as download the files.

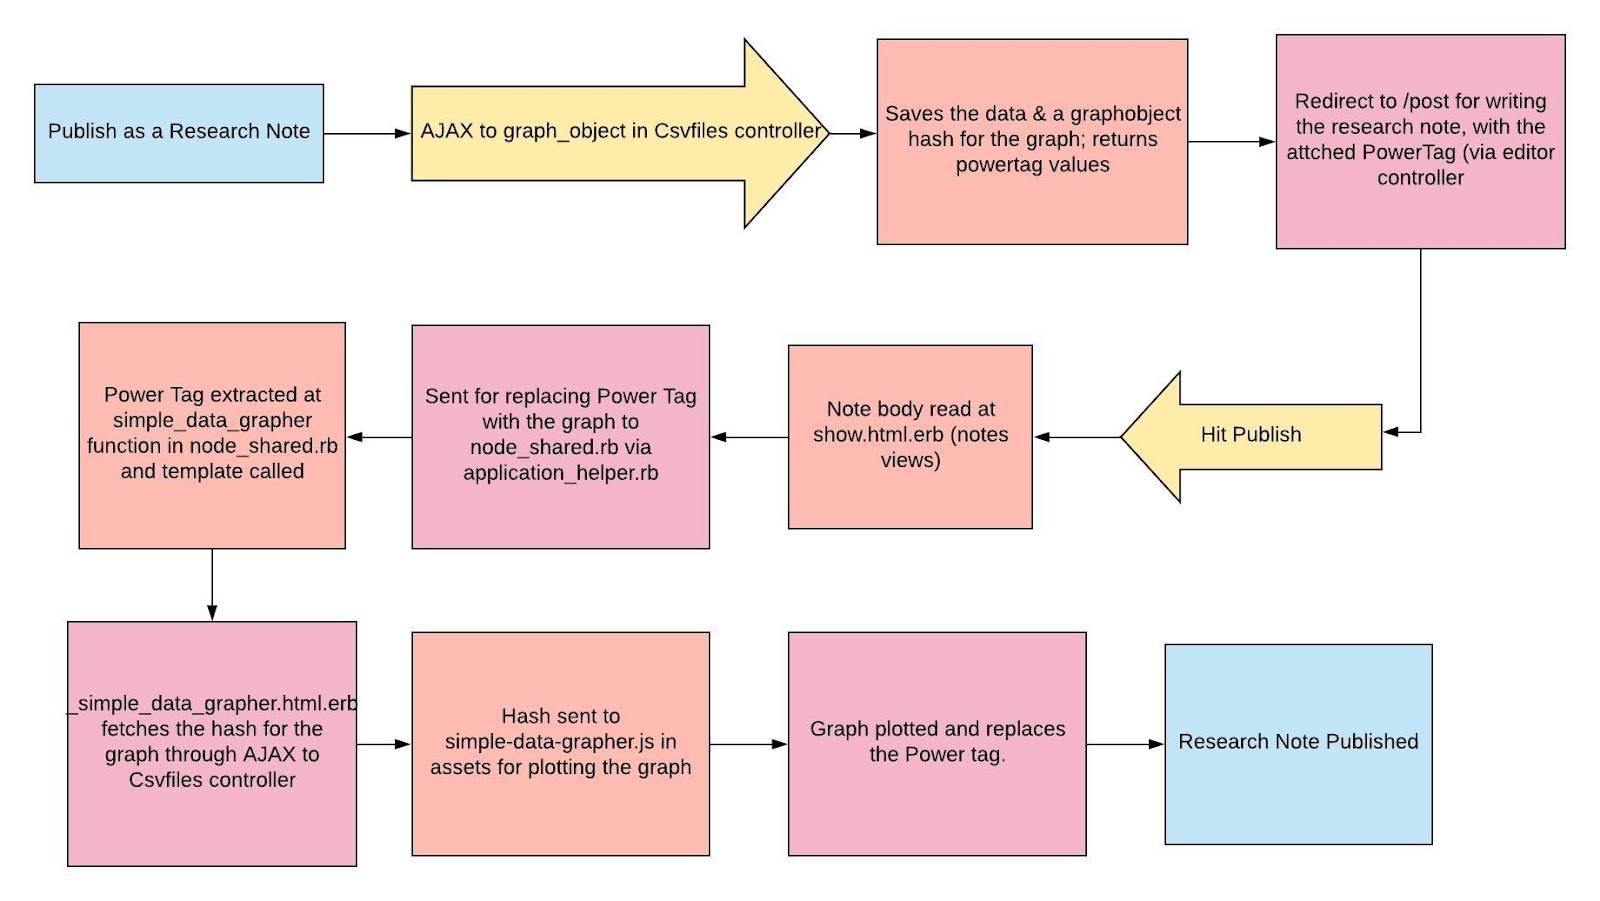
The user can publish their plotted charts as a Research Note on Public Lab and discuss their findings.

Working with Public Lab for about 9 months now has been a humbling experience. The community has been extremely helpful and I have enjoyed working with amazingly talented people.
I have learned so much, before and during GSoC, both about development, and how to work in different projects, and I want to continue to do so in the days to come.
I will remain active as a contributor and would love to be a mentor for the upcoming Google Code-In.
I have actively welcomed new-commers in plots2, and simple-data-grapher.
Links to relevant issues in plots2
Links to relevant issues in simple-data-grapher
It's been one packed summer for me and I have worked on this project from scratch, one by one executing the ideas I had suggested in my proposal. But as I went along, I stumbled upon a few more additions that can be well implemented.
Some of the planning issues I have in my mind are:
-
A more comprehensive UI Design, taking into account from users and making the process of uploading data handier. Views on this
-
Possible integration with MapKnitter, as mentioned by @ebarry on one of the Open Code Calls.
-
Implement an
Update Graphfeature for the plotted graphs. -
More analysis features, showing better conclusions, like basic statistics (mean, median, etc) or export features to sensor data analyzers.
-
Advancing the Graphs:
-
Adding axes details
-
Adding color variations
-
Manipulating data dynamically
-
Making the graphs more interactive and detailed
-
Optimize the code
-
-
Building a stronger open-source community around this new project, by creating more issues and welcoming contributors.
These were a few ideas I had during the project. I would like to take them forward, and would appreciate any more ideas from the members of the community, or potentially, for the next Summer of Code to come!