Last active
March 18, 2022 18:21
-
-
Save Korto19/74a686a08765c1e33ca1d72bf62f22a9 to your computer and use it in GitHub Desktop.
A QGIS field calculator expression to generate pie charts to be inserted into an HTML frame in the composer
This file contains bidirectional Unicode text that may be interpreted or compiled differently than what appears below. To review, open the file in an editor that reveals hidden Unicode characters.
Learn more about bidirectional Unicode characters
| #Korto19 2021 | |
| from qgis.core import * | |
| from qgis.gui import * | |
| import math | |
| @qgsfunction(args='auto', group='Svg') | |
| def svg_Pie(value, donut, pcol, flipper, legenda, feature, parent): | |
| """ | |
| Genera un grafico a torta inseribile in una cornice HTML nel compositore di stampe | |
| <p style="color:Olive"><b>Sintassi</b></p> | |
| <p style="color:blue"><b>svg_Pie</b><mark style="color:black">(</mark> | |
| <mark style="color:red">array(values)</mark><mark style="color:black">,</mark> | |
| <mark style="color:red">donut</mark><mark style="color:black">,</mark> | |
| <mark style="color:red">array(colors)</mark><mark style="color:black">,</mark> | |
| <mark style="color:red">array(descriptions)</mark><mark style="color:black">,</mark> | |
| <mark style="color:red">legenda</mark><mark style="color:black">)</mark> | |
| <p style="color:Olive"><b>Argomenti</b></p> | |
| <p style="color:red"><b>array(values)</b><mark style="color:black"> - array percentuali </mark><br> | |
| <mark style="color:red"><b>donut </b><mark style="color:black"> - raggio del vuoto al centro [0-1]</mark><br> | |
| <mark style="color:red"><b>array(colors) </b><mark style="color:black"> - array colori</mark><br> | |
| <mark style="color:red"><b>array(descriptions) </b><mark style="color:black"> - array descrizioni</mark><br> | |
| <mark style="color:red"><b>legenda</b><mark style="color:black"> | |
| <ul> | |
| <li>[-1] torta senza percentuali e legenda completa</li> | |
| <li>[ 0] torta con percentuali senza legenda</li> | |
| <li>[ 1] torta con percentuali e legenda</mark><li> | |
| </ul> | |
| <h2><mark style="color:Olive"><strong>Example usage:</mark></strong></h2> | |
| <ul> | |
| <li><mark style="color:black"><strong>svg_Pie</strong>(array(.5,.1,.3),.8,array('red','cyan','gray'),array('uno','due','tre'),0)<li> | |
| </ul> | |
| <mark style="color:black"> | |
| <strong> La somma delle percentuali deve essere pari a 1 o inferiore</strong><br> | |
| <strong> Se la somma delle percentuali e' inferiore al 100% ci sara' un settore vuoto</strong><br> | |
| <strong> Elenco dei colori desiderati, se vuoto o in numero insufficiente saranno utilizzati quelli di default</strong><br> | |
| <strong> Elenco delle descrizioni, se vuoto o in numero insufficiente sara' utilizzato il carattere spazio</strong><br><br> | |
| Colori di default in ordine di utilizzo<br> | |
| Red, Aquamarine, Orange, Cyan, Yellow, Green, Grey, Beige, Gold, DarkKhaki, Royalblue, Fucsia<br> | |
| e' comunque possibile utilizzare qualsiasi colore CSS inserendone il nome | |
| """ | |
| dcol = ['red', 'Aquamarine', 'orange', 'cyan', 'yellow', 'green', 'grey', 'beige', 'Gold', 'DarkKhaki', 'royalblue', 'fucsia'] | |
| #aggiunge colori mancanti | |
| if len(pcol) < len(value): | |
| for j in range (0, len(value)-len(pcol)+1): | |
| if dcol[j] not in pcol: | |
| pcol.append(dcol[j]) | |
| #aggiunge vuoti se non ci son testi | |
| if len(flipper) < len(value): | |
| for j in range (0, len(value)-len(flipper)+1): | |
| flipper.append('') | |
| vc = 0.85 | |
| vt = -0.81 | |
| xi = '1' | |
| yi = '0' | |
| if legenda: | |
| riq = '''viewBox="-1.2 -1.2 4 4"''' | |
| else: | |
| riq = '''viewBox="-1.1 -1.1 2.2 2.2"''' | |
| svg_text = '''<svg width="100%" heigth="100%"'''+riq+'''" > | |
| <style> | |
| #legend{ | |
| text-anchor: middle; | |
| font-weight: bold; | |
| font-size: .008em; | |
| fill: purple; | |
| } | |
| text{ | |
| font-weight: light; | |
| font-size: .006em; | |
| font-family: Arial; | |
| transform: rotate(90deg); | |
| } | |
| #perc{ | |
| fill: black; | |
| font-weight: bold; | |
| font-size: .006em; | |
| font-family: Arial; | |
| text-anchor: middle; | |
| } | |
| path{ | |
| stroke: white; | |
| stroke-width: 0.01; | |
| } | |
| </style> | |
| <g transform="translate(0,0) rotate(-90)">''' | |
| if sum(value[0:])>1: | |
| svg_text = 'Somma valori maggiore del 100%' | |
| else: | |
| for i in range (0, len(value)): | |
| pr = sum(value[0:i+1]) | |
| vx = str(math.cos(2*3.14*pr)) | |
| vy = str(math.sin(2*3.14*pr)) | |
| if value[i] > 0.5: | |
| larc = '1' | |
| else: | |
| larc = '0' | |
| svg_text = svg_text + '''<path d= "M '''+ xi + ''' ''' + yi +''' A 1 1 0 ''' + larc + ''' 1 '''+ vx + ''' ''' + vy +''' L 0 0" fill="''' + pcol[i] + '''"/>''' | |
| xi = vx | |
| yi = vy | |
| if legenda == -1: | |
| svg_text = svg_text + '''<circle r="0.06" cx="'''+ str(vc) +'''" cy="1.4" fill="''' + pcol[i] + '''"/> | |
| <text x="1.5" y="'''+ str(vt) +'''" >'''+ "{:.2%}".format(value[i]) + " " + flipper[i] + '''</text>''' | |
| vc = vc - .2 | |
| vt = vt + .2 | |
| if legenda == 1: | |
| svg_text = svg_text + '''<circle r="0.06" cx="'''+ str(vc) +'''" cy="1.4" fill="''' + pcol[i] + '''"/> | |
| <text x="1.5" y="'''+ str(vt) +'''" >'''+ " " + flipper[i] + '''</text>''' | |
| vc = vc - .2 | |
| vt = vt + .2 | |
| if pr > 0.5: | |
| larc = '0' | |
| else: | |
| larc = '1' | |
| if donut: | |
| svg_text = svg_text + '''<circle r="''' + str(donut) + '''" cx="0" cy="0" fill="white" />''' | |
| if legenda: | |
| svg_text = svg_text + '''<text id="legend" x="1.9" y="-1">Legenda</text>''' | |
| #scrive percentuali entro torta | |
| if legenda >= 0: | |
| pr = 0 | |
| for i in range (0, len(value)): | |
| pr = sum(value[0:i+1]) - value[i]/2 | |
| vx = 0.8*math.cos(2*3.14*(pr-.25)) | |
| vy = 0.8*math.sin(2*3.14*(pr-.25)) | |
| svg_text = svg_text + '''<text id="perc" x="''' + str(vx) + '''" y="''' + str(vy) + '''">'''+"{:.2%}".format(value[i]) +'''</text>''' | |
| svg_text = svg_text + '''</g></svg>''' | |
| return svg_text |
Sign up for free
to join this conversation on GitHub.
Already have an account?
Sign in to comment
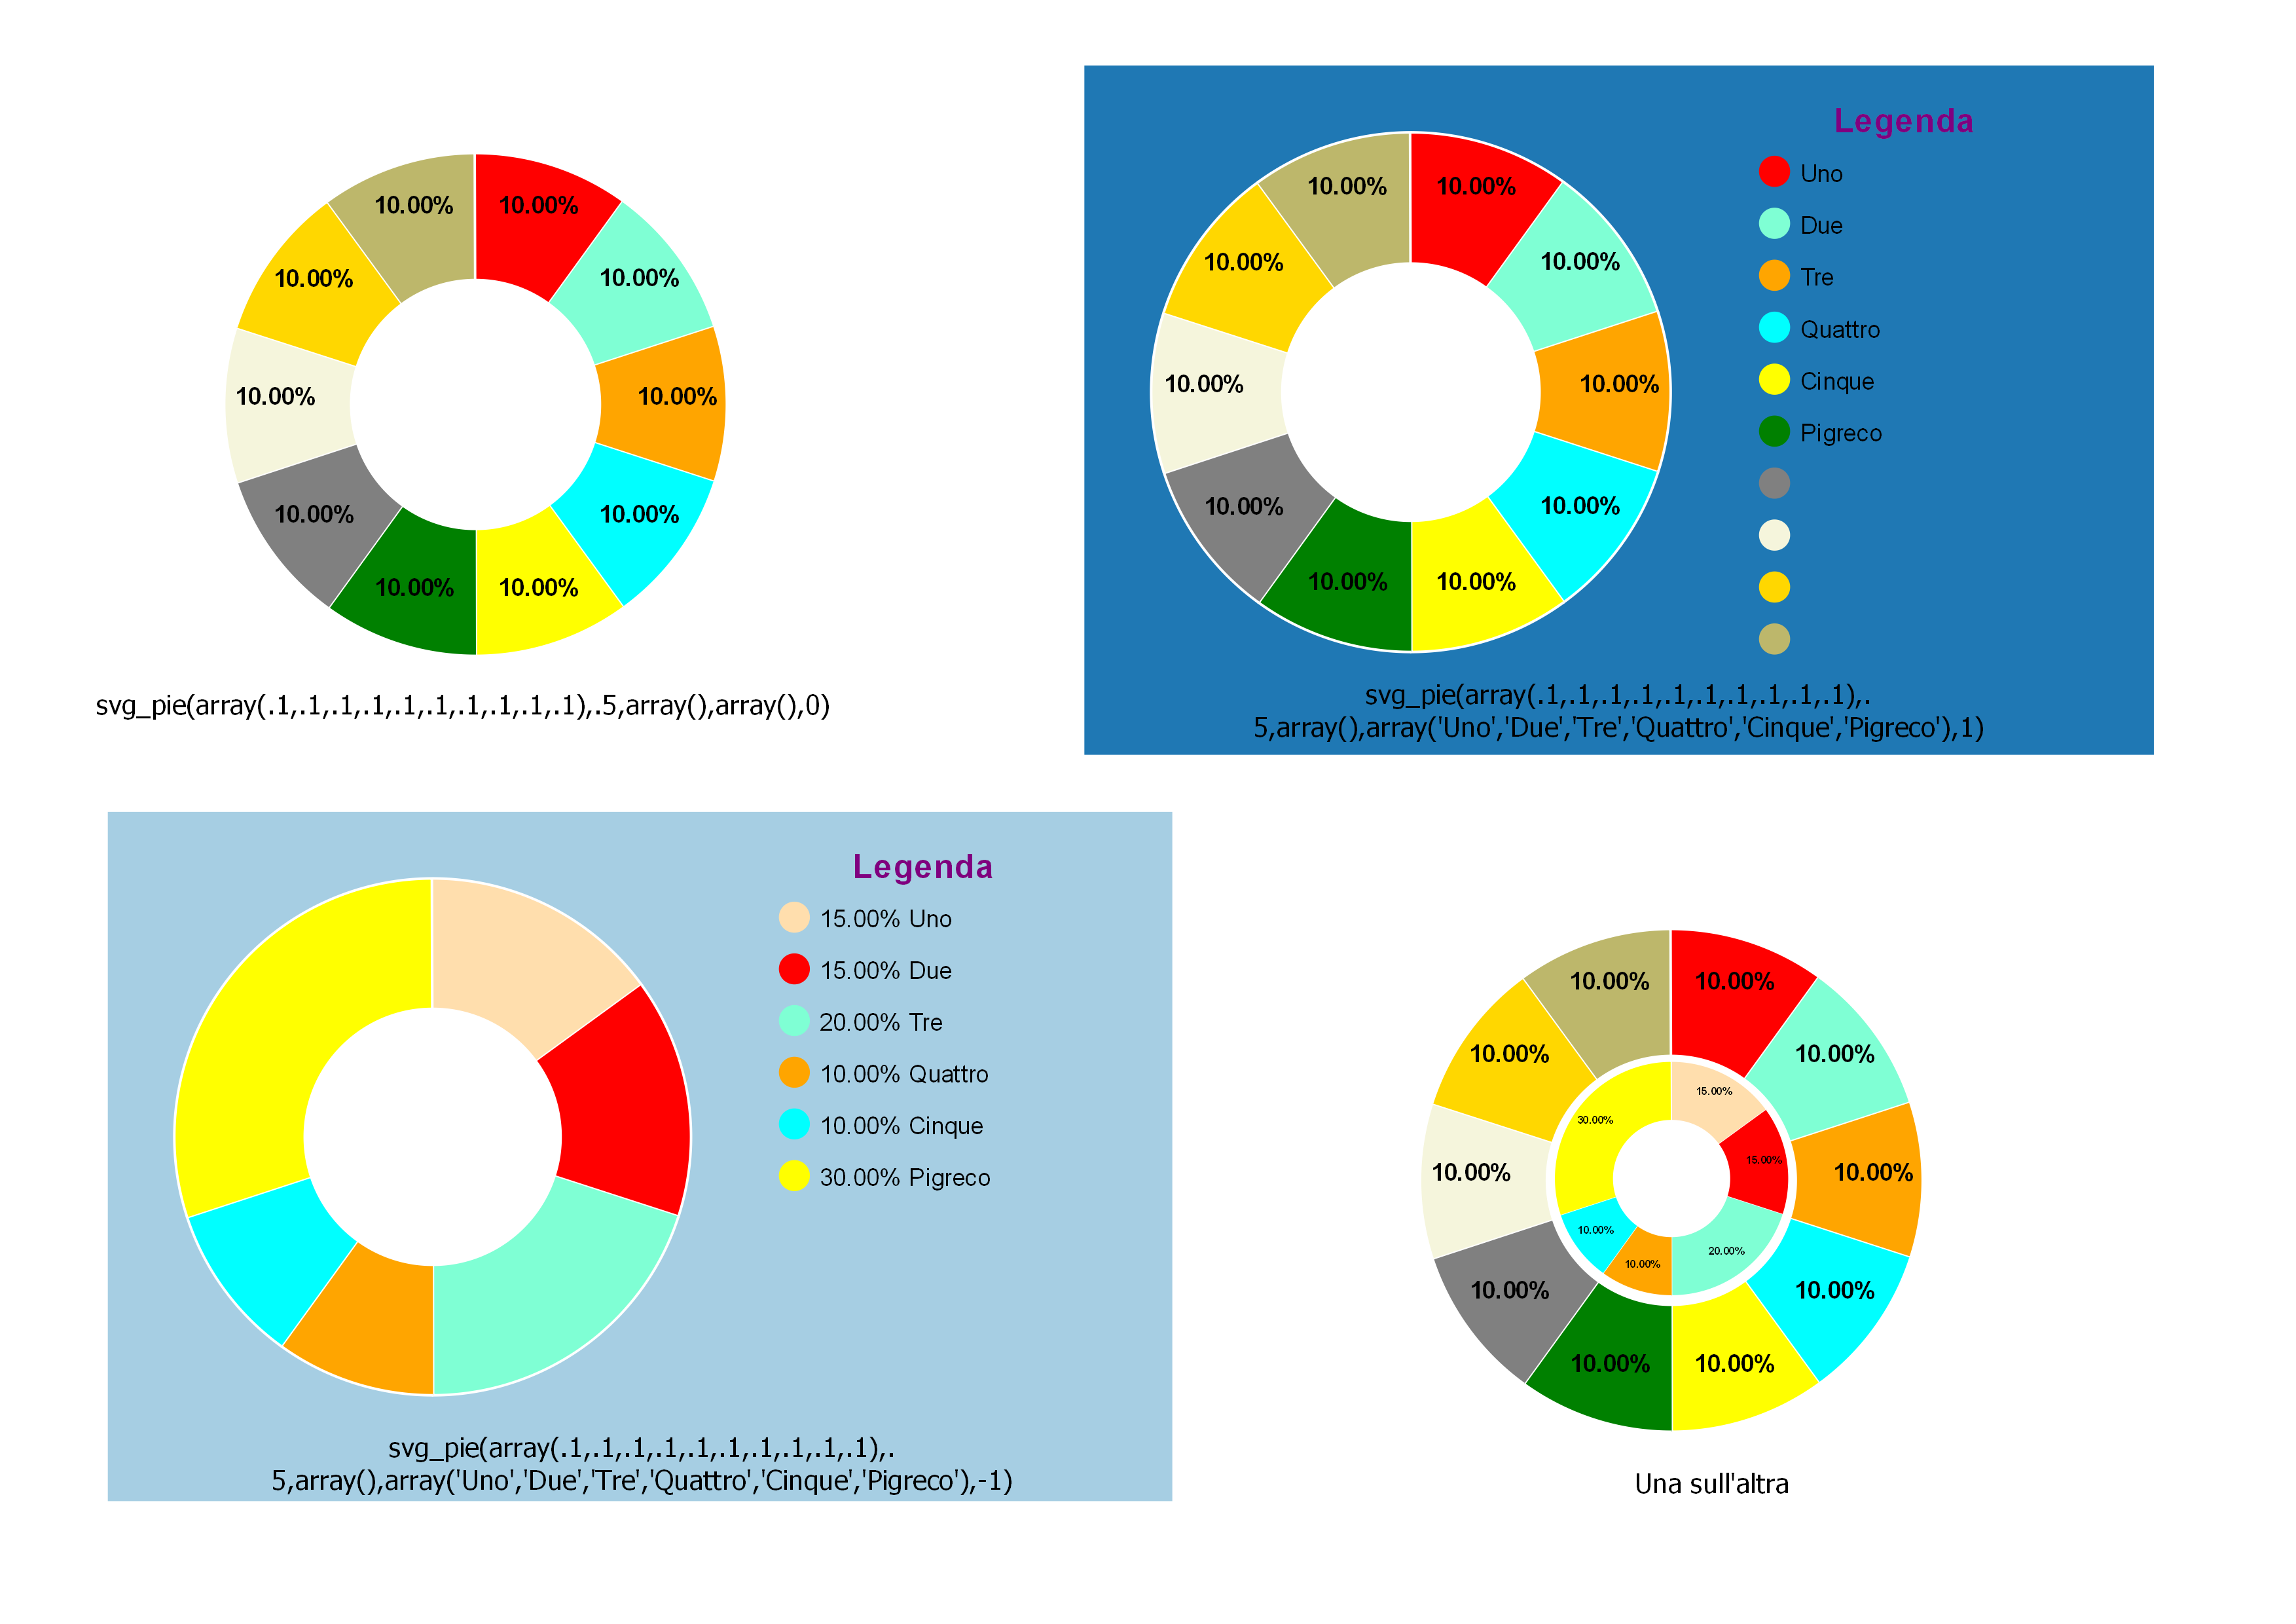
Alcuni esempi di utilizzo