Skip to content

Instantly share code, notes, and snippets.

@Kuri-su
Last active October 7, 2020 11:20
Show Gist options
  • Star 0 You must be signed in to star a gist
  • Fork 0 You must be signed in to fork a gist
  • Save Kuri-su/999959495c264ab49dc69c7b98a87487 to your computer and use it in GitHub Desktop.
Save Kuri-su/999959495c264ab49dc69c7b98a87487 to your computer and use it in GitHub Desktop.
#GrafanaGetStart

{"title":"grafana get start","type":"blogGist","show":true,"description":"grafana 简介"}

Grafana GetStart

[TOC]

简介

Grafana 是一个 数据可视化工具, 使用 Javascript + Go 编写 前后端, 支持 将 多种监控方案的 数据库作为数据源, 读取并展示 报表.

Dashboard

在 Grafana 中, 每张 报表 称为 Dashboard, 一个 Dashboard 中有若干 面板, 用于展示实际数据.

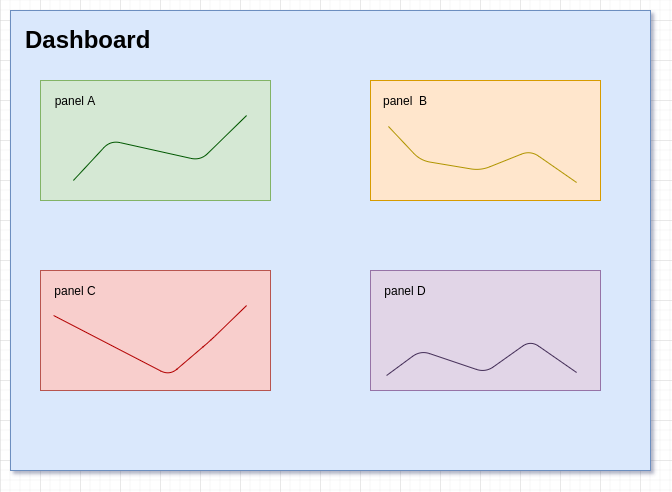
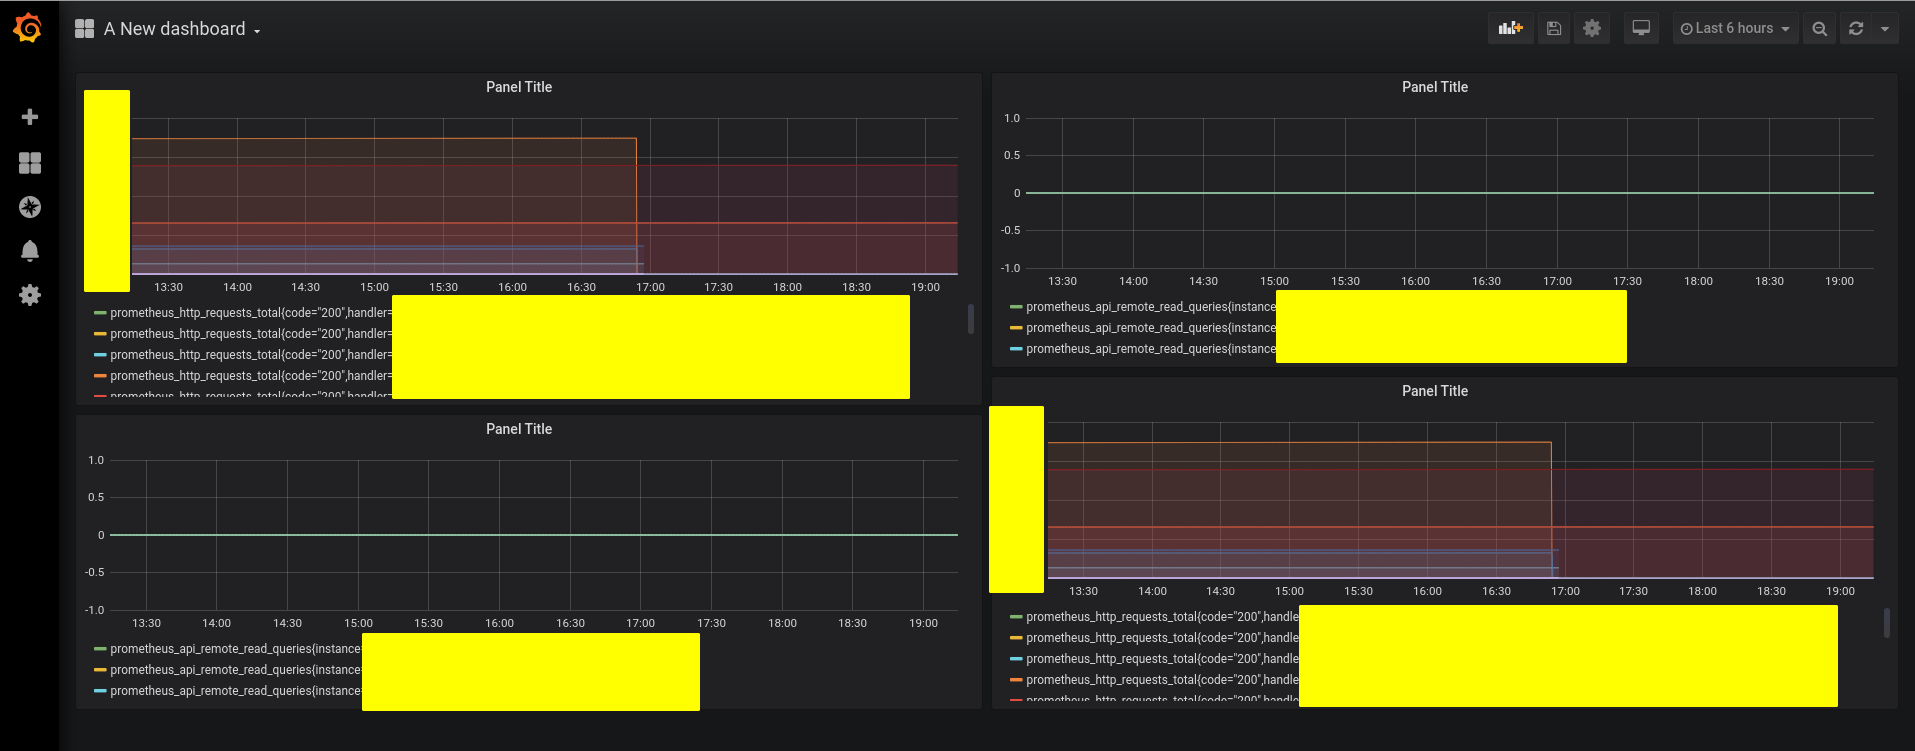
一个 Dashboard 下面有多个 panel , 除了 包含 Panel 外, 还主要包含 时间范围 , Veriable,Version, Annotations 等的配置,

simple panel

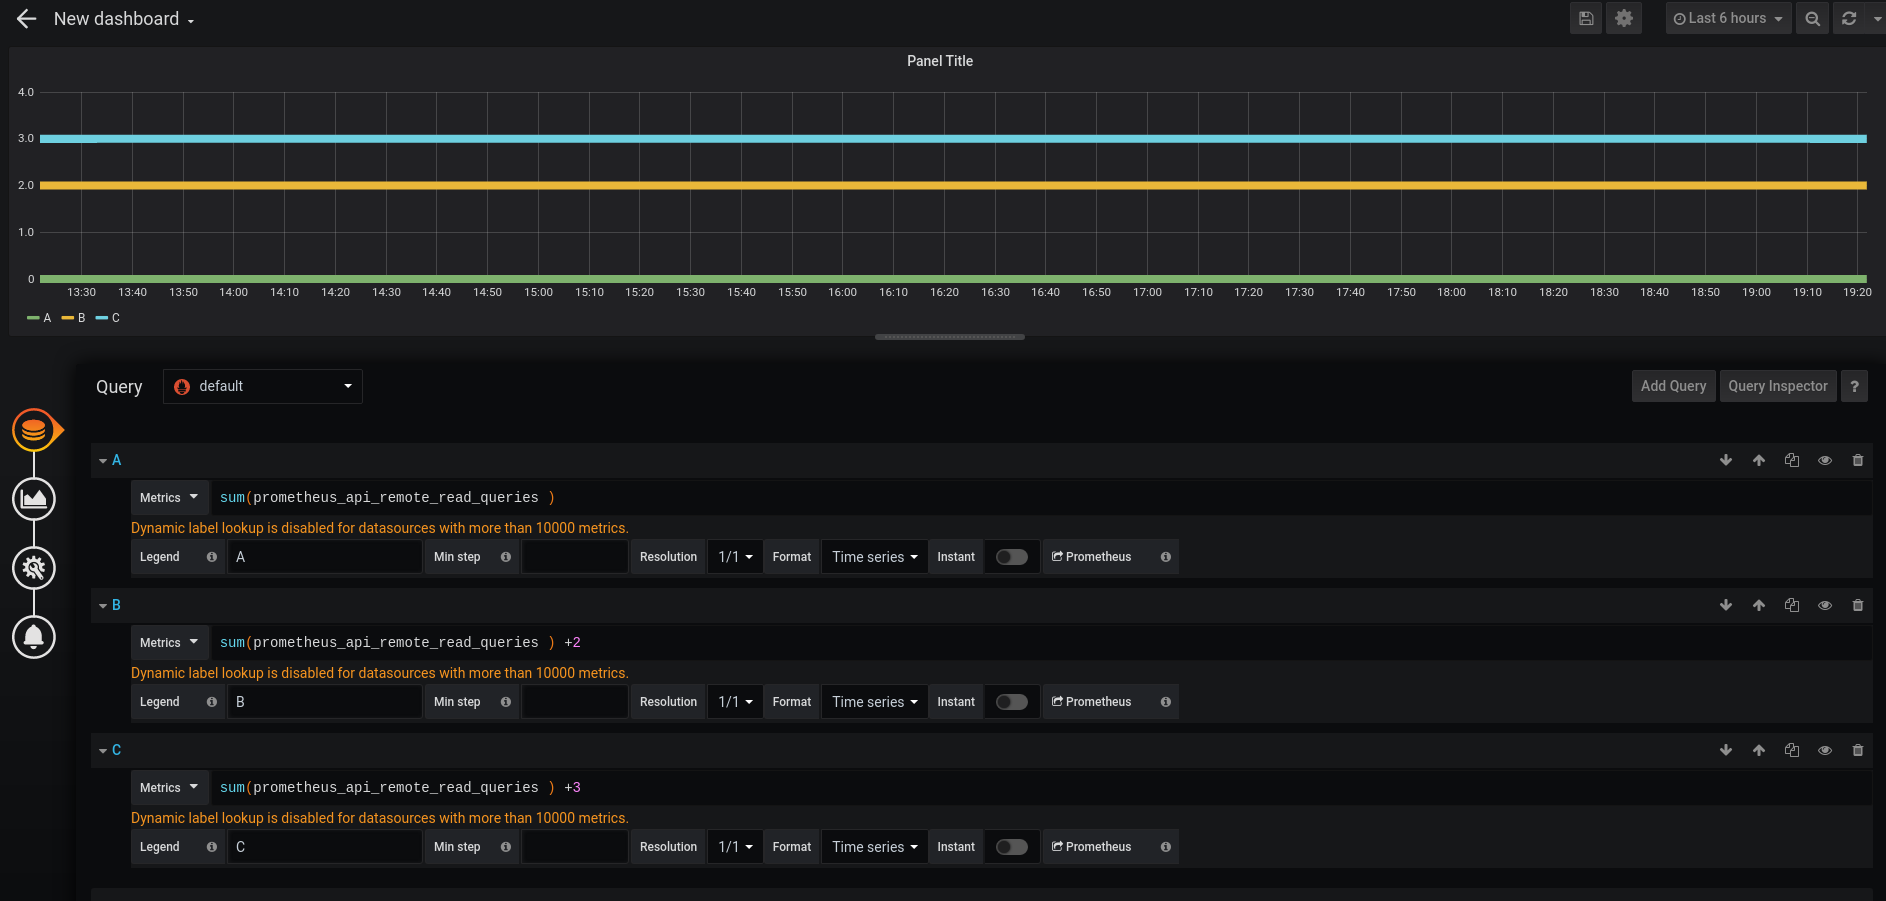
一个简单的 由若干条 查询语句组成, 查询的结果绘制出来得到 Panel 所表达的内容

Veriables

Other Setting With Dashboard

Alert

Explore

Plugins

What's Next

Grafana official Live Demo

Sign up for free to join this conversation on GitHub. Already have an account? Sign in to comment