Skip to content

Instantly share code, notes, and snippets.

View LuisSevillano's full-sized avatar

Luis Sevillano LuisSevillano

View GitHub Profile
@LuisSevillano
LuisSevillano / README.md
Last active March 8, 2018 12:36
Funcionalidades básicas de QGIS (III)

A lo largo de este taller vamos a aprender a generar una capa de puntos a partir de un csv y a trabajar con archivos de tipo ráster.

Funcionalidades básicas de QGIS (III)

  1. Vamos a generar una capa de puntos con datos sobre terremotos desde un archivo de texto. Descargamos los datos desde el Servicio Geológico de los Estados Unidos (USGS).

  2. Accedemos al portal y nos dirigimos al apartado de terremotos y pulsamos sobre Search Earthquake Catalog. En base a los filtros descargaremos un csv con la localización de todos los terremotos de los últimos 3 años: magnitud mayor de 4.5, filtro de fecha: últimos 3 años y en Output options seleccionamoss csv.

    Este buscador tiene un limite para exportar de 20000 registros por lo que si obtenemos algún error es posible que se deba a que hemos excedido el límite de la consulta.

@LuisSevillano
LuisSevillano / README.md
Last active March 7, 2018 16:17
Funcionalidades básicas de QGIS (II)

Este tutorial contempla únicamente el manejo de archivos de tipo vectorial (no se van a tratar archivos de tipo raster).

Funcionalidades básicas de QGIS (II)

Herramientas de geoproceso y análisis vectorial

A lo largo de este taller vamos a conocer algunas de las Herramientas de geoproceso que nos permiten manipular archivos de tipo vectorial. Este conjunto de herramientas se encuentran en la pestaña Vectorial.

Para cualquier cálculo y operación entre dos o más archivos es fundamental que se encuentren bajo el mismo sistema de referencia de coordenadas.

@LuisSevillano
LuisSevillano / README.md
Last active March 5, 2018 16:02
QGIS-funcionalidades-basicas

Este tutorial contempla únicamente el manejo de archivos de tipo vectorial (no se van a tratar archivos de tipo raster).

Funcionalidades básicas de QGIS

A lo largo de este taller vamos a conocer los principales componentes del software de escritorio QGIS.

Panel de capas

Cuadro de la izquierda donde aparecerán todos los elementos que tenemos en nuestro espacio de trabajo. QGIS muestra las capas con que estamos trabajando de una manera ordenada siguiendo un sistema de capas. Podemos activarlas o desactivarlas.
Haciendo doble click sobre una capa accedemos a su panel de propiedades. Vamos a ver algunos de sus elementos principales:

@LuisSevillano
LuisSevillano / .block
Last active February 22, 2017 18:02
Color ramp maker
border: none
height: 600
@LuisSevillano
LuisSevillano / .block
Last active February 19, 2017 16:46
Assign data from csv to a canvas map
border: none
height: 400
@LuisSevillano
LuisSevillano / .block
Last active February 19, 2017 16:45
Retina canvas map
border: none
height: 400
@LuisSevillano
LuisSevillano / .block
Last active February 19, 2017 16:44
Simple canvas map
border: none
height: 400
@LuisSevillano
LuisSevillano / README.md
Created February 9, 2017 15:54
Geo2rect test using nmap

Test using geo2rect and nmap. Dont know how to use nmap to extract a well-look grid.
Now I'm taking those coordinates from the bounding box of each map path but obviously there are some space betweet rects. Any idea?
The map shows the districts of Madrid, Spain.

@LuisSevillano
LuisSevillano / .block
Last active February 1, 2017 18:33
Spanish municipalities choropleth test with Canvas and preprojected TopoJSON
border: none
height: 600
@LuisSevillano
LuisSevillano / README.md
Last active September 13, 2019 09:14
textPath along path

Funny use of textPath svg tag.
I was thinking about to use it in a feature about global warming at the end of 2016. The textPath will follow the cursor along the path when the mouseover event is thrown.
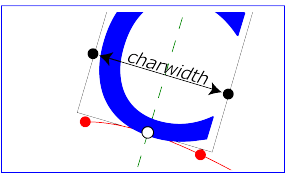
Its a cool effect when you have a smooth line but not when the data is too much variable or irregular. So use of the feature doesnt have any sense. The following pictures show how textPath works:

firstImagefirstImage

"The small dot above shows the point at which the glyph is attached to the path. The box around the glyph shows the glyph is rotated such that its horizontal axis is parallel to the tangent of the curve at the point at which the glyph is attached to the path. The box also shows the glyph's charwidth (i.e., the amount which the current text position advances horizontally when the glyph is drawn using horizontal te