You signed in with another tab or window. Reload to refresh your session.You signed out in another tab or window. Reload to refresh your session.You switched accounts on another tab or window. Reload to refresh your session.Dismiss alert
In this series of pages, I will discuss project reactor and reactive programming from basic concepts to reactor internal implementation details. This discussion is based on the official reference documentation, the java-doc, talks by maintainers of reactor e.g. at the spring I/O and other distributed material, and should summarise and connect all this information. It should complement the official reference documentation and java-doc. Although the name says "from zero to hero", basic knowledge about the library is advised to fully benefit from it.
As a short disclaimer, I am a professional software engineer with some years of experience in using reactor, but not a maintainer or creator of the library. Information and knowledge in this post are based on the official documentation and talks, but I cannot exclude misconceptions on my side.
To understand the problem that Reactor should solve, we first need some insights about thread management by the operating system:
In a modern setup we have a multicore processor: one cpu socket with multiple cores accessing the same memory. Threads need also to be distinguished, as there are user-level and kernel-level threads:
User-level/Software threads are threads created and managed by the process e.g. a java application with java threads
Kernel-level/Hardware threads are "physical" threads built into the cpus architecture and managed by the operating system
Due to efficiency, a core of the cpu is split into two hardware threads appearing to the OS as a separate logical processor: a dualcore cpu has 4 hardware threads. In common OS (Windows, Linux, Solaris) there is a one-to-one mapping of software to hardware threads.
Scheduling a hardware thread onto a cpu core
When a new thread is scheduled, the one currently running needs to be stopped and persisted for rescheduling in the future. This procedure is called context-switch where the instruction pipeline is flushed, the content of registers, current position in the instruction stack and some metadata is stored which takes a long time from a cpus perspective. [2]
The Problem
Given an java application with a lot of threads for example a Spring MVC web service using the tomcat server, which creates a new thread for each client request. When the application only does cpu intensive computation, java threads are scheduled to hardware threads with perfect efficiency.
Imagine the application depends on another web service or database and the java thread needs to fetch and wait for its data. As the operating system does not manage software threads and therefore does not know that the java thread is blocked waiting for a http request to return, the java thread is scheduled onto a hardware thread effectively busy waiting [3], while another thread could potentially do some real work.
The Solution
Project reactor is all about resource efficiency. The core idea is to create a thread-pool equal to the amount of cpu cores available and do the blocking aware scheduling within the java application, keeping the cpu utilization high. Reactor also works with the publish-subscribe pattern, communicating in push-based and not pull-based manner. As in busy waiting [3] and traditional implementations of multi threading, a thread waiting for a resource needs to repeatedly check if the result has arrived yet and continue waiting if it isn't. Reactor pushes the result to the waiting subscribers when it is ready so they don't have to check and again consume cpu time.
Project Loom vs Reactor
Project loom coming in Java LTS 21 aims at at similar concept, as to provide an blocking/waiting aware thread scheduler within java. There will be virtual threads and a managing thread pool. The thread pool and scheduler schedules virtual threads onto software threads, which are then as mentioned above, scheduled onto hardware threads that are again assigned cpu cores. The difference is that the virtual thread scheduler is aware of waiting/blocking threads and acts accordingly. Virtual threads are of lighter weight and can be created of potentially unlimited amount without an performance impact.
The question of loom vs reactor cannot be answered yet, since project loom is as of Feb. 2023 only in preview and currently there hasn't been any data on usage and performance in production environments. It also depends on the current usage of frameworks and technologies. Spring MVC services could be migrated with ease while applications using Webflux a migration from reactor would mean an significant effort. Reactor is not only a thread management library, but also provides means of error handling, timeouts, retries, caching, observability, publish-subscribe and many other operators.
It may also depend if RSockets or gRPC is on your roadmap as RSockets go hand in hand with Reactor.
When to use Reactor
Keep these principles in mind:
You Ain't Gonna Need It
premature optimization is the root of all evil [4]
However, such fundamental decisions like programming language or threading models and frameworks cannot be saved for later when there is a need for optimization, because you would have to rewrite all your existing applications and code. Using Webflux and Reactor for an application cannot be seen as premature optimization, because it is a design decision with a larger context in mind than micro-architecture. It could be the priority of the efficiency software quality characteristic or economic reasons, like the use of the same technology in other services and the knowledge of programmers about that technology.
Nevertheless, keep both principles in mind when working with reactor and only use it when you need it. Publishers of reactor (Flux/Mono) create a significant performance overhead compared to plain synchronous java. Reactor is here to handle asynchronous calls. When you are not doing such calls, you don't need to use an publisher or one of its operators.
Multiple concurrent paths of execution depend on one another and need to share some data. So the base problem the pattern solves is synchronization. There are many different settings and matching solutions (message passing, mutex and semaphores) of this problem, but the one the pattern solves is a n:1 relation, meaning multiple paths of execution depend on the result of one.
Core Concept
We have two participants in our pattern: the publisher, who produces some data and many subscribers, who are interested in the data and consume it. Our two participants can do some actions: the subscriber can subscribe to a publisher, signaling its interest in the data and the publisher can notify all subscribers with the data, when it is ready. Compared to other mechanisms of synchronization, this flow can happen concurrently without having to wait, in a fire and forget manner with push-based communication. Subscribers don't have to wait until the data arrives, but can continue with some work and just define actions to do, when it arrives. Vice versa the publisher does not have to wait until the subscriber is ready for receiving the data, but just pushes it to him.
classDiagram
Publisher *-- Subscriber
Subscriber <-- Publisher
class Publisher{
-List<Subscriber> subscribers
+subscribe(Subscriber)
}
class Subscriber {
+notify(data)
}
Reactor Publisher
The Lifecycle
In reactor there are two main implementations of a publisher, Flux (0,n) or Mono(0,1). When a publisher is created from a source (eventually emitting some data) one could apply a chain of operators to process that data and pass it to the subscribers in the end. Therefore we happen to have three phases in the lifecycle of a publisher:
assembly
subscription
execution
At assembly time the publisher is created and the chain of operators is defined. Then there is the moment of subscription, when a subscriber subscribes to the publisher and at last the execution time, when the code we defined in the source and chain of operators is executed.
Nothing Happens Until You subscribe()
Very important to note is that nothing happens until you subscribe(). When you specify a Mono with a chain of operators in your code, you are at assembly time. When this code (of defining a operator chain) is executed, you just prepare the code to execute, when the data of the publisher arrives. The moment you call the method subscribe() or block(), you are at subscription time and the execution will start, hence execution time begins. At the end of the execution time, subscribers receive the result data.
Behind The Scenes
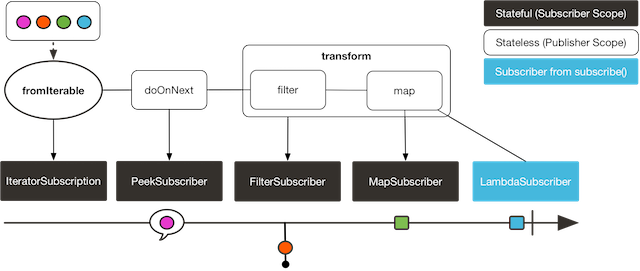
Publishers are immutable. When you use an operator, a new immutable publisher containing the operators logic is created and returned. The operator publisher subscribes to our source publisher. Therefore, when defining a chain of operators on a Mono, for each operator a new publisher class is created which subscribes at the preceding publisher and publishes to the subsequent. The following diagram of the transform() operator also shows the publisher/subscriber chaining:
In the following example code, the returned instance is commented besides the operator call:
Wait, does this mean calling an operator starts execution?
As mentioned above, execution time starts, when a publisher is subscribed. This only holds for explicit subscriptions and not internal ones, hence only when calling the subscribe() (or block()) method.
Hot/Cold Publisher
Regarding the execution model, there are two types of publishers, which can be naively described as follows:
Hot: publishers, that have the data ready for emission e.g. Mono.just("data")
Cold: publishers, that don't have the data ready and must request it e.g. http client requests
Hot Publishers
Hot publishers are the only exception to the rule of nothing happens until you subscribe since the data is already here and will be emitted.
Cold Publishers
Cold publishers behave like described in the reactor lifecycle and one would expect. When it is subscribed, execution is triggered and when the data is ready, it is pushed to the subscriber.
It must be noted, that cold publishers will start this process for each subscriber. So if two subscriber attach to a Mono performing an http request, two http requests will be made, effectively in a 1:1 relation. The relation can be changed into 1:n, delivering the data to all subscribers without triggering a separate call to the source by using the share or publishoperator. When a subscriber is late and subscribes after the result data was emitted, a new call to the source is made since the late subscriber has missed it.
Cold publishers can be turned into hot ones with various operators, for example by caching the data with cache().
In this episode I will discuss basic operators, used to build business logic. It will not contain an explanation of all operators (you can get it from the highly documented java-doc https://projectreactor.io/docs/core/release/api/) but rather explore chains of operators and various comparisons.
Marbel Diagrams:
Project reactor has one of the best java-doc out there including a specialised diagram type to visualise flow and functionality of operators and methods. It's good to have an rough idea of all existing operators but in general, when you need to implement a non-trivial step in your application, there is probably just the right operator for that, you are currently not thinking of. It's like shopping. When all you own, doesn't really fit, you browse an catalogue and order just the right piece. In general, it is no a bad idea to take a look at the java-doc from time to time, when you feel your code doesn't seem to be intuitive and could do with some refactoring.
When reading the reactor java-doc, you will soon find methods, that seem identical or you can't figure out, what they actually do. To be able to know what these operators do or their differences are, you have to read the marble diagram. There is also a good explanation on these diagrams at the official documentation: How to read marble diagrams[1]
Example: Flux.flatMap vs Flux.flatMapSequential vs Flux.concatMap
As an example, we explore the functionality and differences of operators flatMap, flatMapSequential and concatMap[2]:
When a method on each element returns a publisher e.g. having a flux of ids and calling a webservice for each id, returning a list of items, then flatmap merges all elements of the given publisher into the output flux. As you can see, when an element is emitted at the source flux, a new publisher (horizontal line) is created and eagerly subscribed. Elements of a different type (shape) emitted by the newly created publisher are placed on the output publisher as they come, hence in the order they are emitted.
ConcatMap is a flatMap that orders newly emitted elements according to the source elements. This is done by the subscription (and starting the execution) of publishers created by subsequent elements after publishers of preceding elements completed. Flattening publishers in a synchronous manner.
When looking at flatMapSequential which also keeps the order of elements according to the source (equivalent to concatMap), the difference can be found in the location of the subscription arrow. FlatMapSequential subscribes early to created publishers flattening them asynchronously but keeping the order by queuing emitted elements.
Non-Reactive vs Reactive Operators
As mentioned in the first part of this series '01 Why and when to use Reactor', Reactor should only be used when necessary i.e. when calling asynchronous operations. In the second part '02 Publish Subscribe' we explored that chaining operators is not equivalent to nested method calls, but a series of publishers and subscribers is created, that transfers and processes data using the pub/sub pattern resulting in additional but necessary overhead. Mono/Flux with all their operators look very tempting to use for functional programming in java, but should be avoided for pure synchronous control flow. This does not mean to avoid reactor at all cost, but just to make aware when dealing with synchronous cpu intensive tasks, you ain't gonna need it [3].
That being said, there are reactor operators (the ones for synchronous operations) that don't use the publish subscribe pattern and indeed result in pull based plain nested method calls after macro fusion is applied, but more on that in operator chaining. When writing code in the functional programming style, there are some synchronous java native alternatives to reactor classes such as, Optionals, Streams, Functional Interfaces or even the crazy idea of using Scala code (a functional programming language) that runs in the jvm as well, which can be used in java applications interchangeably [4].
More information about method and object overhead can be found in an analysis [5] by Oleh Dokuka, maintainer of RSockets. When measuring throughput of synchronous functions of reactor compared to an imperative implementation the analysis showed, that this overhead can reduce throughput up to 15% in reactive streams. This overhead decreases with the number of elements in a stream :
Mono<List> vs Flux
Using Mono<List> or a Flux depends on the nature of the data source. Mono<List> asynchronously emits all elements at once and Flux emit elements, where time can pass between them. So to answer the question whether to use Mono<List> or Flux, you need ask yourself if you get the data from your source all at once or one by one. With plain http responses, your response may contain a list of data, so you get all the data at once. The streaming aspect of fluxes is not necessary since there is no waiting between elements and you can fully saturate the CPU. Server-Sent-Events, RSocket, gRPC, R2DBC Drivers or event-driven messaging with e.g. Apache Kafka all have that asynchronous steaming aspect by design and you don't get all elements at once so you will need a flux.
Depending on the business logic, you may often switch between Mono<List> and Flux e.g. when having a list of ids and making http requests for each of the id or when creating an json response body for an http request with a list of items.
Operator-Chaining
Reactive-Streams Optimisations
David Karnok, contributor to the reactive-streams API, suggests in a blog post [6] two ways of optimisation techniques for an implementer of the reactive-streams API (such as project reactor): macro- and micro-fusion.
Macro-Fusion
"Macro-fusion happens mainly in the assembly-time in the form of replacing two or more subsequent operators with a single operator, thus reducing the subscription-time overhead (and sometimes the runtime overhead in case the JIT would be overwhelmed) of the sequence. "[6]
Examples also include replacing subsequent filter calls with one filter and chaining predicates together with an logical 'and' operator.
Micro Fusion
"Micro-fusion happens when two or more operators share their resources or internal structures and thus bypassing some overhead of the general wired-up structure. Micro-fusion can mostly happen in subscription-time. "[6]
There are various variants of overhead optimisations in the micro-fusion concept, but in general it is about reusing queues instead of constantly creating new ones.
Reactor Implementation of Optimisations
Project reactor has implemented micro-fusion, but not macro-fusion as proposed in [6]. Micro-fusion is implemented via the Fuseable interface [7] and provides us with following optimisations:
QueueSubscription: reusing queues in sync and async operations
ConditionalSubscribers: reduce overhead by unwrapping recursive subscriptions into loops
SynchronousSubscription: switch from pub/sub to a pull based fashion for synchronous sources
ScalarCallable: optimisation for scheduling synchronous callables
Although reactor doesn't implement macro-fusion, recurring synchronous operations like:
benefit from micro-fusion, as the pub/sub pattern is discarded in favour of essentially nested method calls and reusing queues, which comes close to an java.util.Stream. But sadly, also mentioned in [5], there are some drawbacks left, compared to an imperative implementation:
lots of nested method calls: with the pull based flow
reduced compiler optimisations like method inlining
Good practices in operator chaining
I didn't want to call it 'best' practices, because these recommendations are my point of view, after reading into the referenced material.
Use the correct operator
Go through the java-doc, read the marble diagrams and use the right tool for the job. When using an existing, already optimised operator that matches your control flow, you don't have to worry about potential bottle-necks and overhead. Your code may also be more readable.
Asyc vs Synchronous operators
Async operators for async operations, synchronous operators for synchronous operations. There is no need to wrap an synchronous mapper or calculation into an operator designed for e.g. network requests. You will most likely prevent some optimisations of micro-fusion.
Manual macro-fusion, aka refactoring
There is no need to call e.g. filter several times in a row when you can refactor predicates together. Also in question of readability, I think a combined predicate is more readable and understandable anyway.
Common Mistakes
Blocking
Methods used with Reactor operators have one responsibility, that is not to block, but handle synchronous and asynchronous tasks correctly. Beware of not that obvious variants like impostor methods: methods that seem to be reactive by returning publishers, but block and do async tasks synchronously by using a non-reactive client or database driver internally.
There are ways to integrate non-reactive sources, clients and drivers either by transferring calls to separate thread pools or building your own publisher, but more on that in part '07 Threading'
As of the reactive streams specification, "If a Publisher fails it MUST signal an onError"8. Therefore reactor encloses all exceptions thrown within the reactor context into an Mono.Error. We don't need to wrap exceptions by ourselves. It is perfectly fine to return manually created Mono.Error instances within an async operator/context, but it would be unnecessary overhead to only use an async operator, for the sake of returning a Mono.Error. Also the handle operator can be used for synchronously emitting error or complete signals [9] (More on error handling in 04 Reactor Operators 2)
Don't
webClient.get()
.exchangeToMono(r -> r.bodyToMono(String.class))
.flatMap(r -> { //prevents microfusion with filterif(validator.isValid(r)) {
returnMono.just(mapper.toInt(r));
}
returnMono.error(newIllegalArgumentException("Invalid value returned"));
})
.filter(this::isOdd)
...
Don't implement asynchronous operations or business logic as side effect and losing their context. You will also lose the ability to cancel these operations, propagate errors or metrics.
Don't
Flux<User> persistUsers() {
Flux<User> users = getUsers();
returnusers.doOnNext(user -> storeUser(user)); //with side effect, store operation not cancelable
}
voidstoreUser(Useruser){...} //blocking call
Note: also an perfect example of an impostor method
Not checking subscriptions
As explained in part "02 Publish Subscribe", when subscribing to a source, data is emitted for each subscriber by default. This means when having a webclient as source, an HTTP request will be sent for each subscriber, even if the request and response is identical. You can share data across all subscribers by using the share, publish or cache operator.
In the second episode of operators I will discuss some of the non-business logic operators to implement:
caching
retries
timeouts
error handling
Error Handling
Recap of part "03 Reactor Operators":
As of reactive streams specification, "If a Publisher fails it MUST signal an onError"[1]. Therefore reactor encloses all exceptions thrown within the reactor context into an Mono.Error. We don't need to wrap exceptions by ourselves. It is perfectly fine to return manually created Mono.Error instances within an async operator/context, but it would be unnecessary overhead to use an async operator just to return an Mono.Error. We also saw how to close the gap between java exceptions and reactor errors in our implementation.
A common mistake in general programming, is not to close resources properly. Your application will then hold the connection to a resource even if it is not using it anymore, preventing others to access it. This can happen in poorly implemented business logic or error handling. Java therefore introduced the try-with-resource concept and the AutoClosable [2] interface.
The resource (the file stream) is properly closed after the try block, regardless of an error.
Reactor has adapted the same concept with the using operator. The interface of the usingWhen operator has publishers as arguments, giving us the ability to work with remote resources, also closing them properly when all goes well and on failure. The following example shows the scenario of creating a remote resource, writing data to it and cleaning up at the end:
//create remote resource returning its idMono<String> createResource = webclient.post("/resource");
//add data to the remote resourceBiFunction<String, String, Mono<Boolean>> addData = (resourceId, data) ->
webclient.put("/resource/{resourceId}")
.pathParam("resourceId", resourceId)
.body(data);
//cleanup temorarily created assets when finished Function<String, Mono<Boolean>> cleanUpResource = resourceId ->
webclient.delete("resource/{resourceId}/tmp")
.pathParam("resourceId", resourceId);
//try with resource over the wireFlux<Boolean> results = Flux.range(0, 10)
.flatMap(data -> Mono.usingWhen(
createResource,
resourceId -> addData.apply(resourceId, data),
cleanUpResource
));
Error handling operators
Reactor provides us with various different operators to react to errors and possibly do some compensation. A nice explanation of these operators can also be found on the official documentation [3] Some of them are:
doOnError to trigger some execution when an error occurs, e.g. logging
onErrorComplete complete chains successfully even on errors (triggering onComplete and onSuccess hooks)
onErrorContinue continue with remaining elements when one results in an error
onErrorMap convert errors
onErrorResume use a fallback publisher as compensation
onErrorReturn return a static fallback value as compensation
Error signals (like complete signals) are terminal, hence completing a chain unsuccessfully where the error occurred. The error signal propagates down the chain of error handling operators, eventually being converted to different error or a fallback value, continuing execution.
Example Scenarios
Extend some data, discarding faulty elements
onErrorContinue needs a compatible preceding operator that drops the element causing an error entirely, continuing with all remaining elements. Could be used when favouring correctness of an system.
Flux<User> users = getAllUsers()
    .flatMap(this::extendUserWithAdditionalData)
    .onErrorContinue((t, u) -> log.error("could not extend user: {}", u, t));
onErrorContinue extends the logic of flatmap, to discard the element when extendUserWithAdditionalData returns an error.
Extend some data, keeping successful parts at errors
Reuse all data that could be fetched successfully as fallback. Could be used when favouring robustness of an system.
onErrorResume could be used to fetch from a different source as fallback or like in this example, to undo some changes performed previously in order to cancel more complex process due to an error occurring. Given a checkout process of an webshop in a microservice architecture: Webcalls are made to orchestrate distributed tasks like initiating the checkout, payment and fulfilment process one after the other, but in case of an error any previously performed steps need to be undone, which is defined in the chain of the onErrorResume operator.
A timeout is one of the most basic resiliency patterns: cutting the connection, when the peer takes to long. Reactor publishers provide multiple timeout operators that throw an TimeoutExcepton when the source didn't emit an item within the given duration. Timeouts are measured from the moment of subscription to the source until the fist element reaches the timeout operator. Timeout operators can be used multiple times, e.g. on an publisher inside an flatMap as an timeout only for the flat mapped source and on the outside chain as a "total timeout"
Example Scenarios
Timeout with fallback
Publishers from source 1 and source 2 have their own timeout of 3 seconds, with a default publisher (an empty mono) as fallback when it is reached. The entire chain has a total timeout of 5 seconds so we wait 3 seconds for each source to emit an element, if one times out we use an empty mono instead to prevent a terminal Error signal, which leaves us with 2 seconds left to map the response from the other source until the total timeout of 5 seconds is reached.
Don't forget to log errors for better observability. In this example, we also have a list of n publisher, we want to collect data from. In the flatMap we extend publishers with each
a timeout
a log statement for errors
and turn error signals to complete signals (which makes it equal to Flux.empy as fallback) to continue with remaining sources when one results in an error.
Retry is another resiliency pattern, resubscribing to a source essentially restarting execution of a chain. Obviously, for time critical tasks retries might not be suitable, but when favouring robustness or even reliability over responsiveness of an system, retries can be very beneficial.
Retry operators exist in a very basic form as .retry(nuberOfRetries) or in a more complex setup with .retryWhen(Retry). retryWhen can be used to implement backoff (time between retries) as fixed delay or exponential backoff. It should be noted that using retry will propagate an RetryExhaustedException when all reties fail and hide the actual error that caused the retry in the first place. Configuring reties with retryWhen and the factory class Retry to set maximum retries and or backoff strategies, allows us to use the RetryBackoffSpec.inRetryExhaustedThrow(...) method to propagate the root error downstream.
Example Scenarios
Rollback on errors revisited, retry important tasks
Revisiting our webshop checkout example, it definetly wouldn't be a bad idea to use retries to recover from errors on an e.g. flaky connection. This simple usage of this operator are some low haning fruits, we definetly need to consider in such szenarios.
onRetryExhaustedThrow needs a BiFunction with the retryBackoffSpec holding information about the retry state and the retrySignal where the error causing exception can be accessed by retrySignal.failure()
When it comes to performance optimisation in computing, caching is one key technology to use. It's not only about speeding up processes, it is also about systems that entirely rely on caching to be usable. Such systems are for example computer architectures, where caching is used to quicken main memory access or CDNs for the world wide web.
Cache-Hierarchy
Cache or memory-hierarchy describes multiple levels or layers of caches with different access times, size or data longevity. The best example for hierarchical caching is an CPU architecture with most commonly three levels of caches. Fast memory hardware is expensive so the first level L1 cache is the smallest in size, but the fastest. The second level L2 is a bit slower but much larger and the L3 ist the slowest but largest cache, before accessing the main memory. With the right cache replacement policy, hit rates and response times can be very high as the L1 cache adapts quickly to immediate data needs and the L3 a bit slower with a longer term strategy in mind.
Cache Locality
The principle of locality[4] is devided into temporal and spatial locality. It is about trying to increase the cache hit rate by organising data and access close to another.
Temporal Locality
With temporal locality you want to organise your tasks with multiple accesses to the same cache entry close to another in time. In that way you want to fulfil all your data access needs before the time-to-live of the required cache entry runs out, resulting in a cache miss.
Spatial Locality
Spatial locality is more relevant considering CPU cache implementations at a lower level. Cache entries are populated in batch, so that nearby addresses tend to be loaded into the cache altogether (even when only one is requested). Due to this behaviour (caused by memory organisation in a computer architectures) it is a viable consideration for performance optimisation to access data in a way that nearby memory addresses are accessed one after the other or even to organise data access to match the cache organisation implementation. This technique should not be underestimated as speedup can be multiple orders of magnitude.
Spatial Locality sounds very low level but can be relevant even for java. Neflix described in a blog [5] discovering an issue in the jvm they were using, related to spatial locality called false sharing. The consequence of the issue was that scaling cpu resources by a factor of 4, throughput only increased by ~25% and latency got even worse.
Caching with and around Reactor
Caching with Reactor
Using the cache operator, caching can be implemented easily caching the next element for a Mono and a number or all elements for Flux. The cache is very simple in a way that it is not organised like a map with key value pair entries but just caches the result of an source. Its simplicity is also its biggest strength as a huge improvement like preventing large repetitive database queries can be achieved without further dependencies or complex configuration:
Consider a webservice expecting a lot of requests for a resource that does not change that often but is expensive in acquiring like large database queries:
For this scenario, we cannot simply use the cache operator on a publisher and call it a day, because the database client or a webclient creates a new publisher for each query. For the caching to work we need of course to keep track of the reference to the publisher that caches the elements and stores the data. Therefore we simply define a member variable in our DAO with the publisher that holds the data in future. Now as mentioned in previous part 02 of this series, execution only starts, when a publisher is subscribed so the call in 1 won't trigger a database call when the DAO class is created. When the getAllActionMovies method in 2 is called by a client and subscribed to, then the data is fetched and cached. Further client calls of getAllActionMovies subscribe to the same publisher instance of 1, using the cached data or initiating a new database call when the time to live ran out.
Caching with Caffein
When working with reactor, caffein caching by ben-manes [6] ist the officially [7] preferred solution for further caching needs like a key value store. The caffein cache is a java native high performance in memory cache so no need for serialisation and deserialisation. Great documentation on configuration and usage can be found in https://github.com/ben-manes/caffeine/wiki and https://www.baeldung.com/java-caching-caffeine.
A basic setup could be the following.
Configuration
The most simple approach is to setup a cache with a expire after write time to live as in 1. In 2 we specify the monitoring of the hit-rate, that can be accessed by cache.stats()
Given in 1 a synchronous cache with the id of an data object as key and the data object itself as value. We check in 2 if the cache is populated with data of the requested key, request and set the data in 3 when it is not contained in the cache.
Caching with Redis
Using redis as externalised in memory cache is a very popular solution. It is fast fairly easy to setup and allows for many different configuration including multiple replicas. Using an external cache is a good idea when you have multiple instances of an application running and you want to share cached data among all instances or persist cached data beyond one applications instance lifetime.
In this episode, I will discuss various methods to implement logging, tracing, metrics as well as how to debug reactor code.
Overview
A common workflow of addressing errors in applications could be the following:
You have multiple applications running on a server. The applications generate logs, metrics and traces on running processes and errors. Maybe you get alerted or discover by yourself, that unintended errors are occurring in an application and something is not working quite right. You start looking into general metrics of client and server responses to localize the issue. Traces help you to identify the exact application that causes the problem and logs of the faulty requests could be collected using a trace id. The logs contain enough information to investigate and reproduce the error-causing request on your local machine. You start to debug the application locally, fix the issue and deploy it onto the server.
This example is a possible workflow of identifying and resolving errors in applications, described in a top down view. As each step, (traces, metrics, logging and debugging) builds upon another and I would rather approach them bottom up.
Test Repository
For testing and demonstration purpose of this and the upcoming parts in this tutorial series, I created a repository with two example applications. A more detailed explanation can be found in the repos readme but in short the use case of these projects is to manage cars for an car-sharing provider.
The applications are the car_service, that provides a REST api to query cars and the clustering_service that calls the car service and clusters these cars based on the distance to another. In the upcoming parts these applications will be extended e.g. with RSocket interfaces.
car_service
Provides cars from a mocked repository and serves endpoints:
HTTP GET /cars to request all available cars
HTTP GET /cars?center=<lat>,<lon>&radius=<radius>
where <lat> and <lon> are coordinates
and <radius> is the radius in meters
e.g. /cars?center=48.5,16.5&radius=5000
HTTP GET /cars/{car-id} to request a single car
clustering_service
Calls the car service and serves endpoints:
HTTP GET /cars/clusters to request all available cars
HTTP GET /cars to request all available cars (pass through to car_service)
Debugging
Tooling
For now we only need to take a look at the car_service. You can try all the tools by yourself after checking out the car_service of the test repository in branch 5-observability-debugging . In this branch and project, bugs have been included and annotated with //FIXME comments. Following tests can be used to run the application to try one of the tools described below:
The .checkpoint() operator is a good way to extend stack traces and show propagation of errors. You can use checkpoint at any location in your operator chain:
When an error signal is propagated down the chain and hits a checkpoint, it is included into the exception as back-trace:
We can also see that there are some additional default checkpoints included via spring webflux, that show us the HTTP endpoint and request parameters. So one could ask whether you have to use a checkpoint after each operator to get good coverage. Gladly reactor provides the reactor debug agent that does more or less the same thing.
Note: Checkpoint back-trace is included into the exception. Therefore the exception must also be logged for us to see it.
Reactor Debug Agent
The debug agent can be enabled by calling Hooks.onOperatorDebug(); at startup of the application or tests. The debug agent now provides us the full back-trace of an error signal, referencing every operator in our application the error was propagated:
Still those trace-backs create additional overhead and might not be that useful. The debug agent will give a more detailed view about the location and propagation of the error but not why it occurred (thinking of problematic values that resulted in the exception). Carefully positioned checkpoints, like the ones from spring webflux, and the good old stack-trace with the exact occurrence of an exception, like we saw in the console output of the checkpoint example, might suffice for identifying the location of an error. Distributed tracing will also help in regards to that, but I'll come to that later.
Logging Signals
The .log() operator can be used to log passing reactor signals (onSubscribe, onNext, onError ...). A very common issue when starting with reactor is, that the code doesn't seem to be executed. As discussed earlier nothing happens until you subscribe, which is the reason for this issue most of the time. Sometimes, the problem lies elsewhere but in any case it would be worth a try to look at the signals, that are passing our chain.
Given an application to retrieve a list of cars and a corresponding test. Our test expects an endpoint to return a list of 20 cars but fails with this result:
Response body does not contain 20 elements expected:<20> but was:<0>
Expected :20
Actual   :0
We use the log operator at two locations in our application to follow the signal flow, investigating if the cars requested get unintentionally filtered. This gives us following output:
We can see the subscription (eliminating the error cause of not subscribing), request of elements and immediate onComplete signals passing our repository and service log. This means our source used in the repository does not even emit any objects which is the cause of the problem.
Hint: Using log with form .log("log name", Level.INFO, true) includes the line number of the log operator into the output which can help to distinguish the log statements.
There are also bugs that consist of incorrect return values and not from exceptions. Logging onNext signals throughout the application can help you tracing those incorrect values to their source and where they are assigned. A more convenient way to do that, is the IDEs debugger, but that doesn't work for every case.
Using the IDE Debugger (Intellij IDEA)
I'll restrict this discussion to the Intellij IDEA debugger, as I am most familiar with it, but different IDEs might have the same features. When placing breakpoints in reactor code, we have to distinguish the code that runs at assembly time and the one that runs at execution time. Simply placing a breakpoint at the line of an operator will stop the application, when the chain is assembled, not executed. To inspect values in execution, we need to place it within the method that is called by the operator or onto the provided lambda, which can be selected like this:
Stepping over methods in a stopped application won't be that useful also, as there is happening a lot in reactor internal methods. You could rather make use of additional breakpoints and restart the application to get there. When there isn't a suitable method or lambda in place, you can always place a .map operator returning the same value as a workaround for debugging:
Flux.range(0, 10)
  .flatMap(someTransformation)
  .map(e -> e) // <--- place this line and a breakpoint at the lambda to see what values are passing here
  ...
Simple Conditional Breakpoints
A helpful tool are conditional breakpoints. After placing a breakpoint, right-click onto it to open a context menu. In the text input field "Condition" you have access to the scope at the breakpoints location and can define a condition, when the application should stop:
Non-suspending Conditional Breakpoints
As shown above, breakpoints can be configured not to suspended (stop) the application via the context menu. Non-Suspending breakpoints are recognized for being hit but don't do anything else.
The condition of breakpoints can be set to the fact that another breakpoints was hit. This can be done via the extended context menu of breakpoints (when clicking "More" in the smaller one).
Now we can combine both features and only enable a breakpoint after another (maybe a non-suspending one) was hit.
Given the following code sample, a NumberFormatException could be raised in line 34 and 36. We want to debug the path of the code, when the exception is caught in line 43 but was thrown in line 36 and not 34. This can be achieved by not suspending at line 36 and make the second breakpoint conditional that the first one in line 36 must be hit first.
This is very useful when you try to follow a certain path through the application or your condition of breakpoints need a larger context e.g. when a certain parameterized test case is executed.
Intellj Debugger Reactor Integration
Introduced in version 2023.2 and only available for the Ultimate edition is the reactor streams integration. A live preview and more information about it can be found at the Intellij blog post https://blog.jetbrains.com/idea/2023/06/reactive-programming-made-easy/.
This feature allows us to view all items in a flux or mono at a breakpoint, like the debugging view of java streams in Intellij. A very helpful feature, sadly only available for the Utlimate edition.
Debugging Approach: Where, When, What
Now that we viewed some tools to ease local debugging, I also want to share a general approach that helped me figure out one or the other more difficult bug.
You surely will have noticed by now when it comes to debugging, reactor makes things a bit more challenging compared to plain iterative code. Reasons for that are stack-traces extensively filled up with reactor internal calls, reactor life cycles (assembly, subscription and execution), reactor signals (next, error, complete) and the asynchronous aspect of the whole story. One approach to debugging reactor code and overcoming these obstacles is to answer the following questions in the process:
Where does the issue occur? (what chain, path of execution, operator or method)
When is it happening (at which life cycle)?
What is happening (which signals are emitted)?
Where does the issue occur?
Before starting with anything else we need to get a rough idea of where the issue occurs. That "where" does not have to be the exact location of the issue but rather a part of the application where it may reside. Once we know where to start, we can go to the next step and repeat this approach in multiple iterations. Checkpoints or the reactor debug agent might help.
When is it happening?
We need to keep in mind that reactor has three life cycles and errors can happen at any of them.
is execution even happening?
is the chain successfully assembled?
Place breakpoints onto operators.
What is happening?
What signals are transferred down the chain. Is subscription happening? Do you even get items with onNext signals. Are there any onError signals that might get transformed later. What do the onNext signals and items look like? Are they as expected?
Use log operators to display reactor signals. Place breakpoints inside methods that are called by operators to inspect passing values.
Logging
Logging, besides metrics and traces, is one of the three pillars of observability and in regards to that, reactor applications do not differ from any other. There is a lot of material available on how you should or shouldn't do logging and I won't get in detail on that, but rather focus on reactor and spring webflux relevant aspects of it.
Confidential Data
However, one very important topic I want to point out, is logging of confidential data. When dealing with confidential information like sensitive PII, payment details or credentials you should pay attention to either not include such data into your logs, or secure the logs and logging backend to the same degree as the system that initially stores and processes it. When doing so (storing confidential data inside logs), keep in mind also to comply with any GDPR legislation of deleting such data.
Error Logs
A key aspect of good error logs is to include necessary information (also about the context of the error) to understand why it happened or even to reproduce it on a development environment or on your local machine. Another challenge is to log errors and exceptions only once because multiple logs of the same exception can be very confusing and to do it uniformly for the entire application. Applying principles of single responsibility and separation of concerns would suggest to have designated component to do logging for e.g. I/O so you have a baseline of logs. You can then extend this baseline with logs inside specific sub-routines and functions, where you may only have access to some information. Then again it could be a challenge to log exceptions only once and connect all that logs, but that problem is solved by trace-ids of the distributed tracing solution.
Logging I/O
Besides access logs, it can be especially useful to log the I/O, that resulted in an error to be able to reproduce it. This can be applied to all kinds of application but for web-applications, logging the client request along the error response is a good idea. With spring we can use the ResponseEntityExceptionHandler class to implement a centralized and uniform error response handler. With functional endpoints the exception handler won't work and we need a ErrorWebExceptionHandler[5]. An example for such a ErrorWebExceptionHandler as global logging baseline could be this:
Again keep in mind not to log any confidential data like credentials, that might be passed as request header.
Logging error causing elements
As mentioned earlier, logging data and context that produced an exception can help to understand the issue. Back tracing elements in chain that resulted in an exception later on is not that straight forward, as we lack a suiting operator like doOnError(Throwable t, Object o). The operator onErrorContinue(Throwable t, Object o) seems to go in the right direction, but transforms the chains functionality into not stopping at errors, but to continue with remaining elements.
A global solution to this could be using the global reactor hook Hooks.onOperatorError(BiFunction<? super Throwable, Object, ? extends Throwable> onOperatorError) like in the test project.
On the on hand, we could simply log the object that caused the error, but on the other hand we want to keep this log along the one of the actual exception, prevent multiple logs of the same exception and maybe reuse the logging implementation of the exception handler. The element could be included into the throwable, which is then logged through the GlobalExceptionHandler along the request, that caused the whole situation. Sadly, throwables don't provide something like payloads so you'd have to create a new throwable class with that payload and either nest the original exception into it or include the throwable containing the element as cause of the initial exception. Wrapping the exception covers up the actual error, might be counter-intuitive and nesting the error causing element as cause of the exception suits the circumstance much better, so I went with this approach in the test repository:
In this example I just put the element as a string into the message, but a cleaner solution would be to create a separate class with a payload property, that is processed within the error handler or logging implementation. A structured logging solution could need access to the actual object and not a string representation. In the example code above, any stacktrace is eliminated because it wouldn't give as any useful information and bloat the log.
This solution results in following logs of stack-traces:
Now with this information, one can see that the lon property is null (but we knew that before via the initial exception message) and also that the problematic object is the car with id 11. A follow up step in the debugging process could be to lookup the car with id 11 in the repository as it may be stored there in this invalid form.
With this solution, beware what has been mentioned earlier about confidential data. It could be useful to exclude some classes, packages, explicitly include classes, packages or to transform them to eliminate any confidential data. In the test project there is a simple implementation for explicit includes and excludes of packages and classes with possibility for external configuration.
Don't forget to log errors when using fallbacks
I'd say the worst error log, is no log at all. This holds not only for obvious cases, but also when using fallbacks to transform an error into a successful result. When you don't log the fact that an error occurred and the fallback was used instead, you might never know that there was something wrong.
Logging Stacktraces
One difference regarding reactor errors are huge stack traces of exceptions that are included into logs. In some cases, these can be even so large that the logging backend can't process them and hast to split them up in multiple log entries (I've seen that happening). There is always the possibility to limit the size of the stack traces like in the GlobalErrorResponseHandler
Reactor Lifecycle Hooks
Reactor also provides some operators to trigger a callback function when a event is happening in the chain. They are a good way to include logging not only for errors, but also for other events, like doOnComplete
Metrics
Metrics are very important when it comes to error detection, especially in large systems. They are excellent for general system overviews when aggregated, but also useful to dive in deeply and get very detailed information about an application, the operating system or the environment it runs in.
USE - RED - The Four Golden Signals
There are hundreds of metrics you could monitor, but without alerting (which can also be difficult to set up for some applications) and no one who checks them, they are pretty much useless. So a good approach could be to have a dashboard for very detailed metrics, when they are needed for debugging, but just a hand full to check regularly or to configure for automated alerting. Mentioned alerts should be an indicator for overall system health and cover the entire system to prevent any blind spots. There are several approaches to the metrics selected when establishing such monitoring.
Saturation (amount of work, a resource has to do; often queue length)
Errors (count of error events)
The USE metrics were initially chosen to detect errors in operating systems and this approach exists for a long time now. For modern Web-Application a different approach would be more suitable, so Tom Wilkie from Grafana Labs established the RED Method.
Traffic (how much demand is placed on your system)
Errors (rate of requests that are failing)
Saturation (how “full” your service is)
The Four Golden Signals were defined by Google in "Site Reliability Engineering". [7] Compared to RED, latency can be seen as duration, traffic as rate and the term 'errors' is used in both approaches. So one could say 'The Four Golden Signals' extend RED with a metric for system saturation, which could indicate issues in application up- or down scaling.
Micrometer Metrics
Micrometer is a metrics facade that is tightly integrated into reactor and can be used out of the box. It supports various different back-ends, that can be found here: https://micrometer.io/docs.
When creating metrics, we need to distinguish how to organise them: hierarchical or dimensional [8]:
Hierarchical Meter: Meters and samples can be identified by their name without tags e.g. http.requests.server1
Dimensional Meter: Meters are identified by their name and samples by tags e.g. http_requests{application="server1"}
When creating a meter, we need to think about the organisation of samples and how to structure them. We also need to account for querying at the back-end and how to aggregate and visualise the metric. With Prometheus as back-end and querying with PromQL, it is far easier to aggregate, filter and select tags than actual metric names, so dimensional organisation should be preferred.
Reactor Metrics
Metrics can be created anywhere in the application and used with life cycle hook operators like doOnSuccess, doOnError. After importing the reactor-core-micrometer dependency, the tap operator can be used to create metrics for a selected chain. A list of those meters can be found at the official reference documentation. meters created with tap Depending on you meter organisation strategy, tags and meter names can be specified by operators tag and namehttps://projectreactor.io/docs/core/release/reference/#_tags.
The underlying netty web server of webflux applications also provides a series of built-in metrics that can be useful for more detailed debugging. Most important metrics for the client and server like request/response duration and status are integrated into webflux out of the box. The remaining ones have to be manually enabled at the netty web server. For webflux applications it could look like this:
@ConfigurationpublicclassNettyMetricsConfigurationimplementsNettyServerCustomizer {
@OverridepublicHttpServerapply(HttpServerhttpServer) {
returnhttpServer.metrics(true, uri -> "/*"); //provide proper uri to tag mapping function
}
}
It should be mentioned, that these metrics create an measurable but mostly negligible performance overhead. One metric exposed measures pending tasks for the netty event loop. This one can be seen as a metric for saturation or rather over-saturation (see 'The Four Golden Signals') and could show problems with provisioning and scaling applications.
Distributed Tracing
There are many observability APIs and solutions, but I will mostly refer to the OpenTelemetry API specification. It is a CNCF supported project to standardise all vendor specific ones.
If you seek for more details and explanations on tracing concepts like spans, baggage, observations, observation registries and observation conventions refer to:
Instrumentation happens inside your application and is about measuring processes, observing the application and creating the observability data like logs metrics or traces. There are two ways to instrument your application [11]:
Auto-Instrumentation: Bytecode is manipulated and instrumentation code is injected after compilation.
Manual: Program code is instrumented manually or by a library like micrometer.
Collection
Created data has then to be exported to a back-end. Collection can happen pull or push based. Prometheus metrics are exported pull based, where a collector periodically accesses the /prometheus endpoint of applications, where as e.g. logs with Logback are exported push based, so that applications push the logs to a logging back-end/collector like Grafana Loki.
Processing and Querying and Storage
After collecting observability data, it is forwarded to a logging, metric or tracing back-end where data is processed, stored and can be accessed via some queries like PromQL for Prometheus.
Depending on your needs and system size, there can be various different configurations. For small scale systems most observability back-ends like Grafana Tempo for traces can be used as collector so that applications push data directly to Tempo. At larger scale this would not be sufficient and we need explicit collectors, that handle the load of vast observability data collection. Then these explicit collectors act like a load-balancer and forward the data to the back-end where it can be accessed.
Visualisation
To visualise, interact with the data and create dashboards, we need a visualisation solution like Grafana or Kibana. In a best case scenario, the visualisation solution connects to all back-ends and can correlate logs, metrics and traces together like in this demonstration: https://www.youtube.com/watch?v=qVITI34ZFuk
Tipp:In case you already implemented the ELK stack for logging and want to use Grafana with Tempo and Mimir or Prometheus, you can also integrate Elastic-Search into Grafana and benefit from log correlation
OpenTelemetry Specification: one common language
When collecting observability data, it has to be transferred using some API. For now there are various different solutions available, which bring their own APIs like Zipkin, Jaeger, Prometheus and so on. The OTel spec. aims to create one means of communicating and collecting all observability data including logs, metrics and traces. So in larger scale applications, instead of having an Prometheus exporter, FluentBit for logs and a tracing collector, you would have one (or multiple replicas) OTel collector forwarding data to the corresponding back-end.
management:
tracing:
enabled: truesampling.probability: 1.0# set to 1 only for development
Tracing out of the box (Autoconfiguration)
Done! Spring Webflux (and also MVC) applications instrument all server (netty, tomcat ...) and client (Webclient, RestTemplate) requests via autoconfiguration when all necessary dependencies are available.
Manual instrumentation
Reactor chains, that are not instrumented via Spring can be included using the tap operator as with metrics. With tap you can also create children spans for a chain if it is subscribed in another (e. g. with a flatMap) already observed one. In that way, a more detailed view of the control flow in your application can be created.
For manual instrumentation, you need access to the ObservationRegistry, which can be injected easily using Spring DI.
Some configuration for the infrastructure components has been taken and adapted from following projects, that provide good explanation and demonstration as well:
This is a very small project so to keep things simple, I did not configure an explicit OTel Collector, but use the designated back-ends directly. Therefore we can not benefit from having just one API and have to use the one from each backend solution.
Logging
SLF4J
Logback
Grafana Loki Backend
Metrics
Micrometer
Prometheus Backend
Tracing
Micrometer
OTel Bridge
Grafana Tempo Backend
Visualisation: Grafana
Many projects may already have a logging and metrics solution and want to add tracing. One logical step towards a uniform solution would be adding tracing using the OTel spec and switch existing solutions towards OTel later by introducing an OTel collector at first and migrating each solution one after the other. All necessary infrastructure components are defined in the docker-compose file in the test projects root directory and can be started with a simple docker compose up.
You could very well say that, but one could also argue about where a design pattern ends and a programming paradigm starts. As your quote already states reactive programming as a paradigm, I'd also say it is more that just a pattern (a common solution to a common problem), but a way of structuring computer programms much like functional programming with an emphasis on threading.


The reactive programming paradigm is often presented in object-oriented languages as an extension of the Observer design pattern.Maybe it's an extension of the Observer design pattern ?